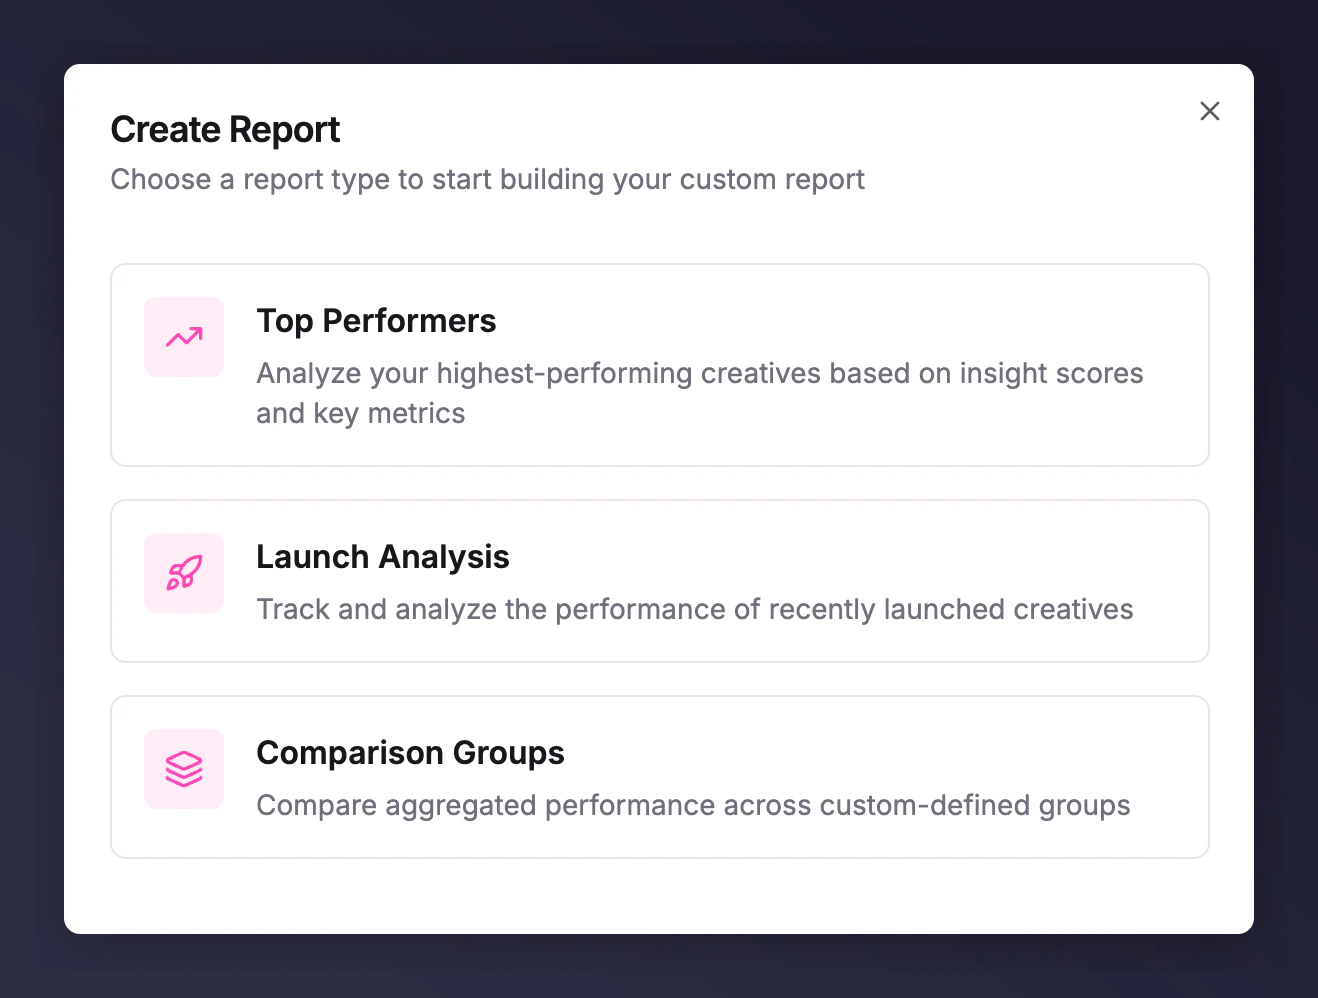
Creating a Comparison Groups Report
Select account and timeframe
At the top of the report, select which account and timeframe you want to segment ads for.
Define ad groups
Select the platform from the dropdown on the left of the first row, then name your segment (e.g. “Static”, “Video”, “Product”).
Add filters
Using the Add filter button, select filters to capture the ads you want in each segment (e.g. Ad Types for each segment).
Using the Report
Once you’ve defined your segments, the reporting UI below the segment editing section provides the same tools as the Top Performers report:- Choose a visualisation: Grid view (default), bar chart, or time series.
- Scroll down to see a data table.
- Click into any group in Grid view to see a side panel of the ads in that group.
- Add or change metrics at the top of the visualisation.