The Debug Dashboard helps you check that your data is flowing correctly into Mention Me. It gives visibility of orders, customer details, and any issues that may need fixing. Data is retained for 30 days.
Why use the Debug Dashboard?
- Confirm your orders and customer details are being received
- Spot issues like missing data or duplicate orders
- Share examples with your Mention Me contact if something looks wrong
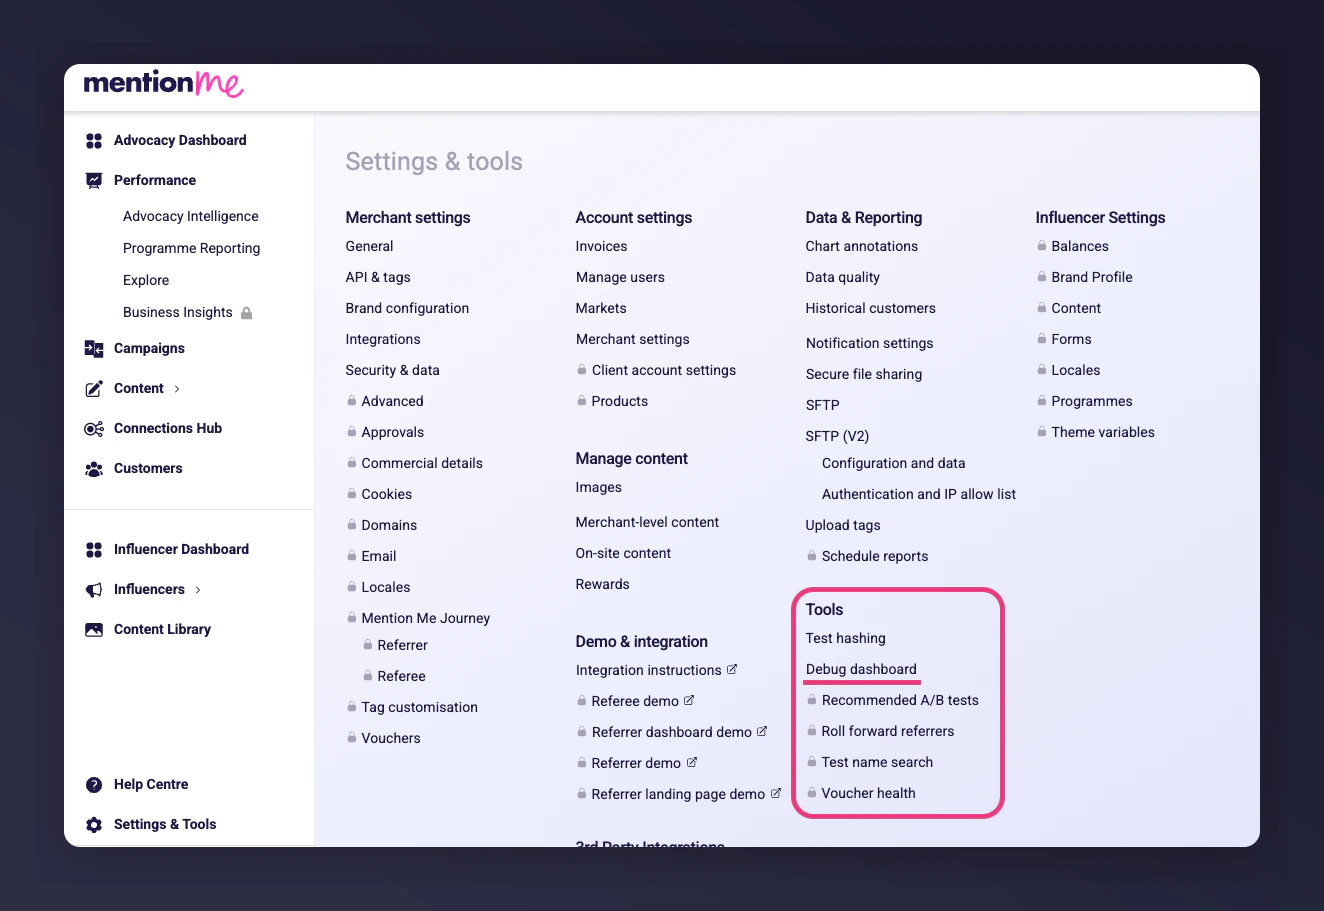
Accessing the Debug Dashboard
Find the Debug Dashboard under Settings & Tools > Tools > Debug Dashboard, or search for “Debug Dashboard” in the search bar.
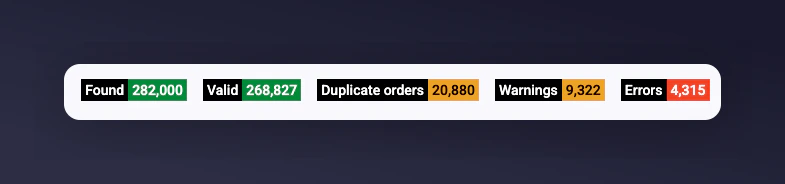
At a Glance
The top of the dashboard gives you a quick health check:
- Found: All records received
- Valid: Records successfully processed
- Duplicate orders: Orders sent more than once (e.g. duplicate tag firing)
- Warnings: Data was accepted, but something is missing or unusual
- Errors: Data could not be processed (requires attention)
Most of your data should appear as Valid. A few warnings are normal. Lots of duplicates or errors may suggest a setup issue.
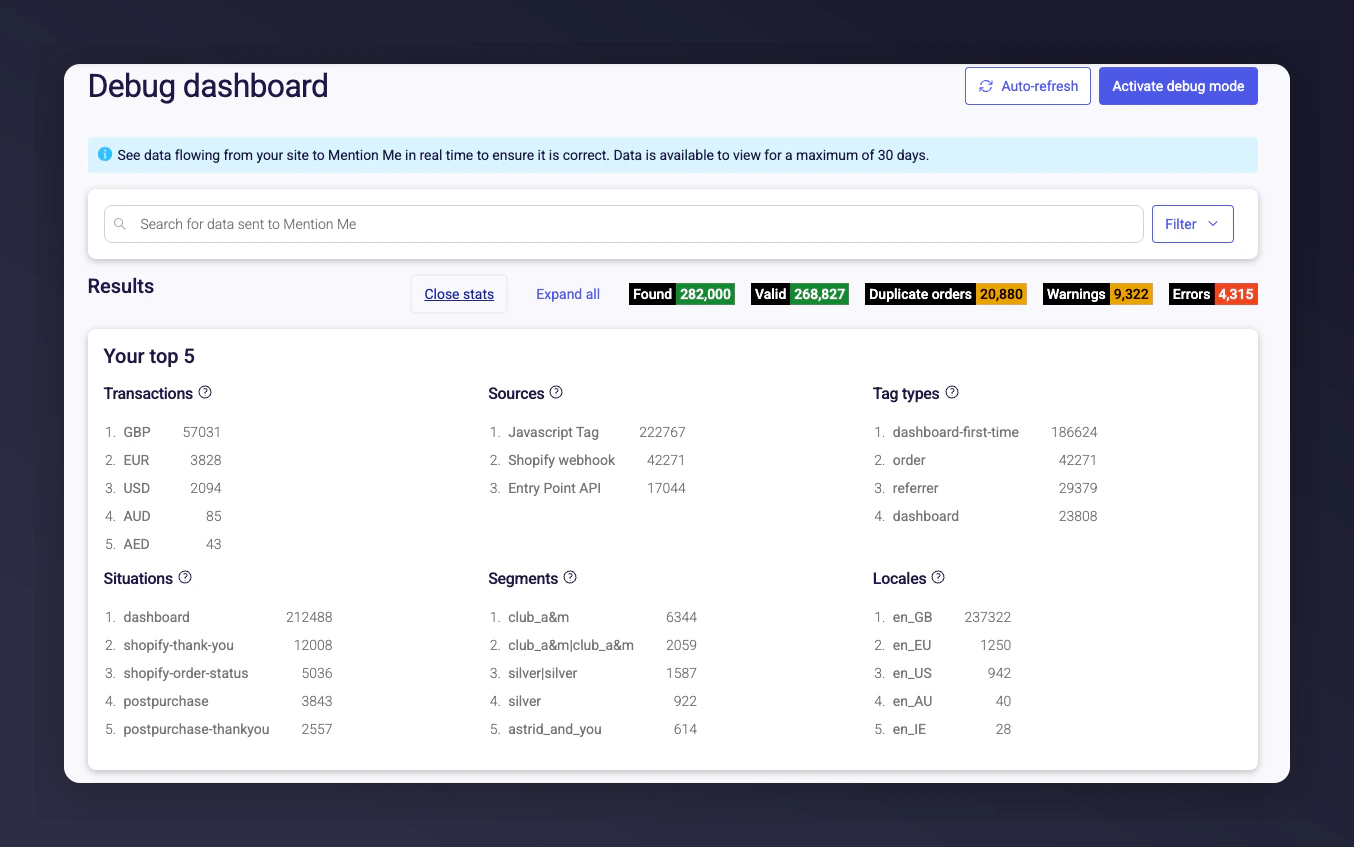
Exploring the Data
Beneath the summary stats are “Top 5” lists showing the most common data sources:
- Transactions: Currencies of received orders
- Sources: How data reached Mention Me (e.g., tag, webhook, API)
- Situations: Where the tag fired (e.g. thank-you page)
- Tag types: What kind of tag (order, referral, dashboard)
- Locales: Site or language the data came from
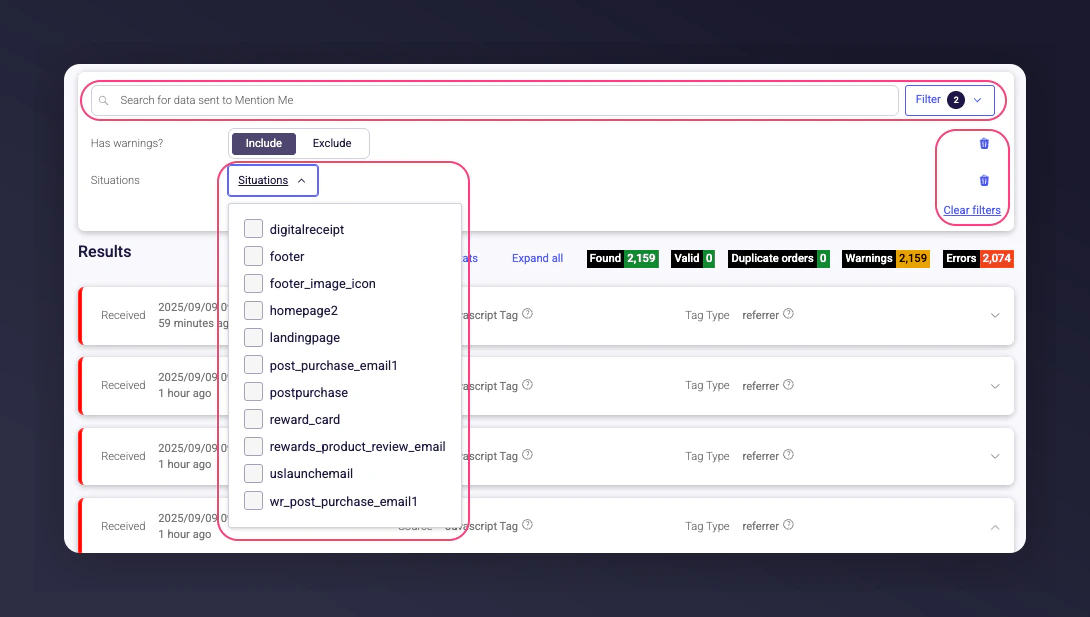
Filtering the Debug Dashboard
Use filters at the top of the dashboard to focus your view:
- Search bar: Search by order ID, email, etc.
- Has warnings?: Filter records with warnings
- Parameter filters: Filter on situation, locale, currency, type, etc.
- Clear filters: Reset all filters for a full view
When to use filters
- Troubleshoot errors: See if errors come from a specific situation (e.g., postpurchase)
- Validate a campaign: Check that data is being received from the right source
- Investigate warnings: Look for patterns
- Check a case: Search by known values like email or order ID
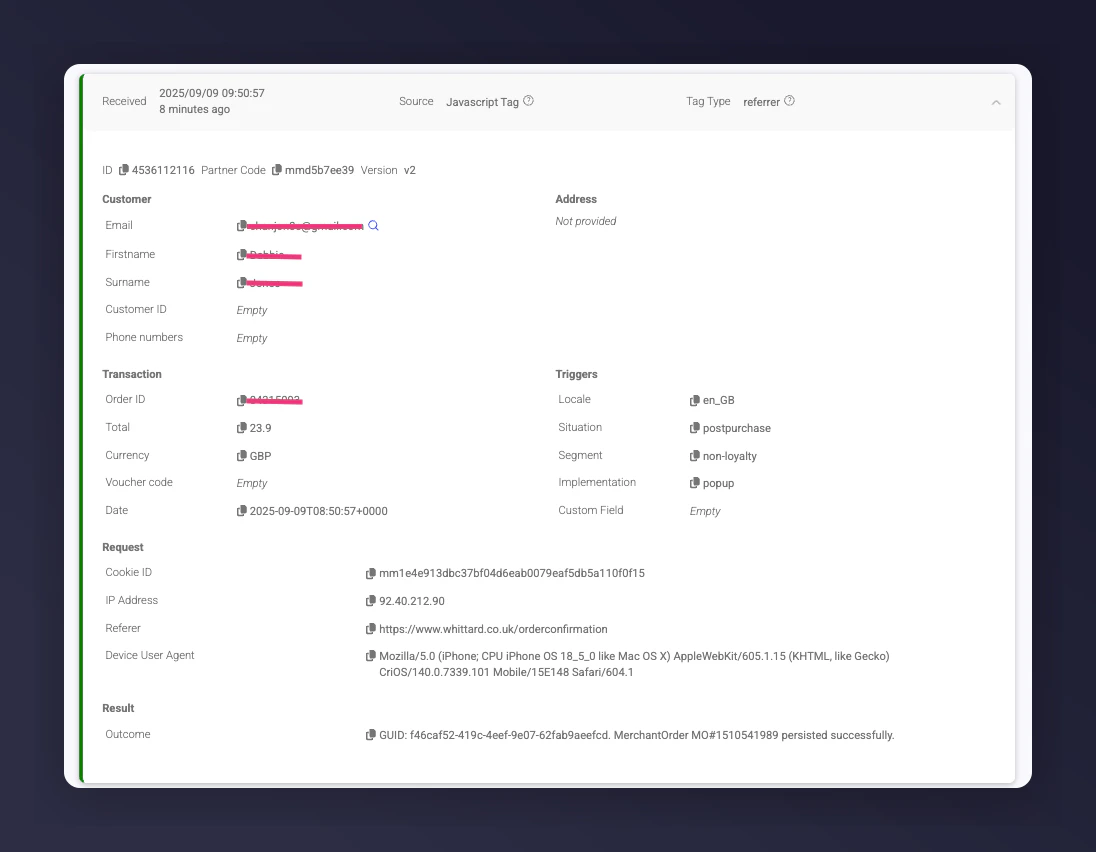
Looking at Individual Records
Click a row to expand details:
- Customer: Email, ID, and name
- Transaction: Order and purchase details
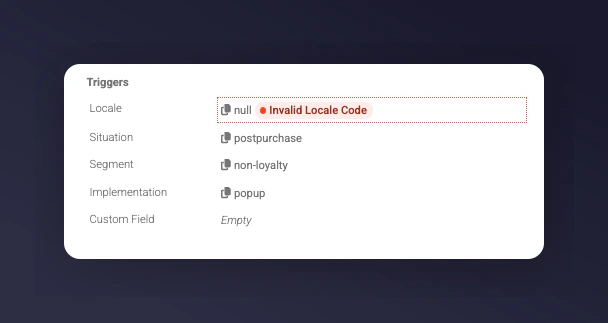
- Triggers: Locale, situation, segment, and type (e.g., popup, embed)
If everything shows as green (Valid), no action is needed.
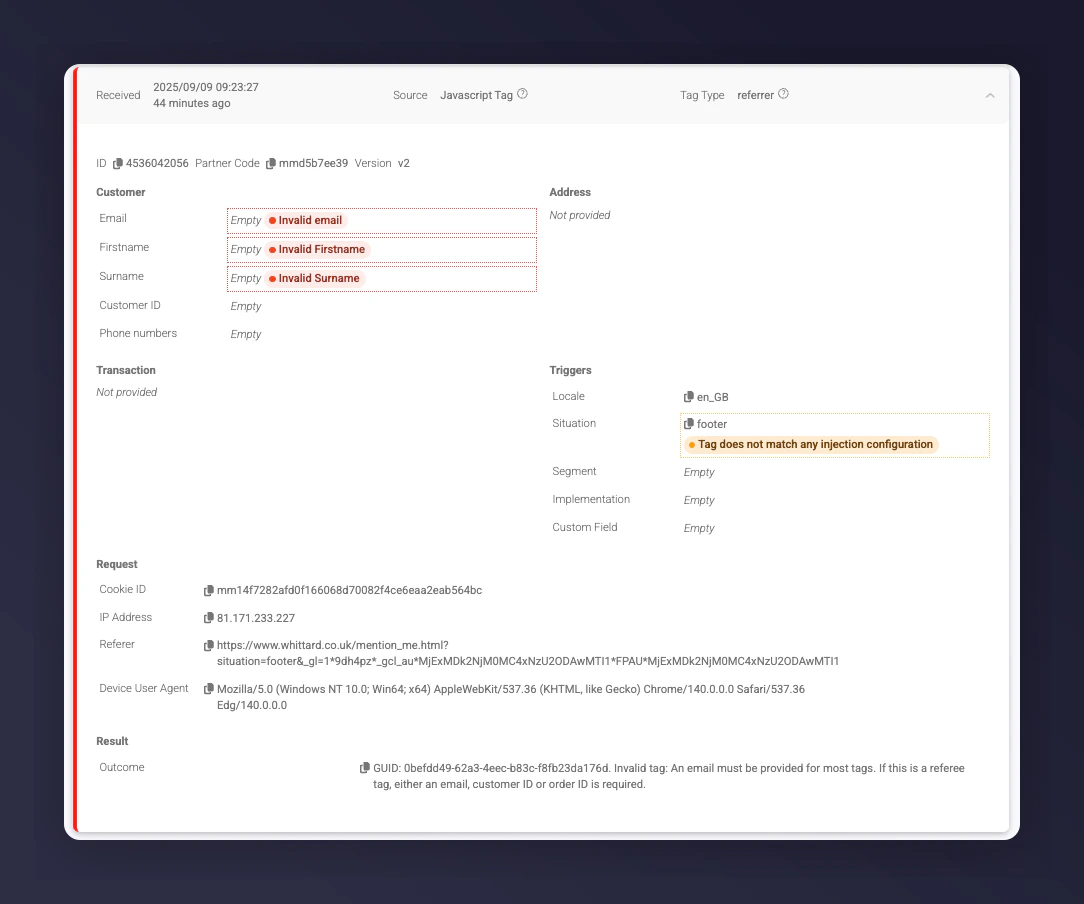
What to Do If You Spot Issues
- A few warnings: Normal, no action needed
- Lots of duplicate orders: Check your postpurchase tag or your order API integration
- Errors: Note the affected rows and share them with the Mention Me team or submit via the Help with Tech form. Include the page URL with filters applied.
Empty Values
Empty values aren’t always a concern:
- A landing page referral tag may not capture data until the form is completed
- A transaction total marked as “empty” might just be a dispatch update, not a real order
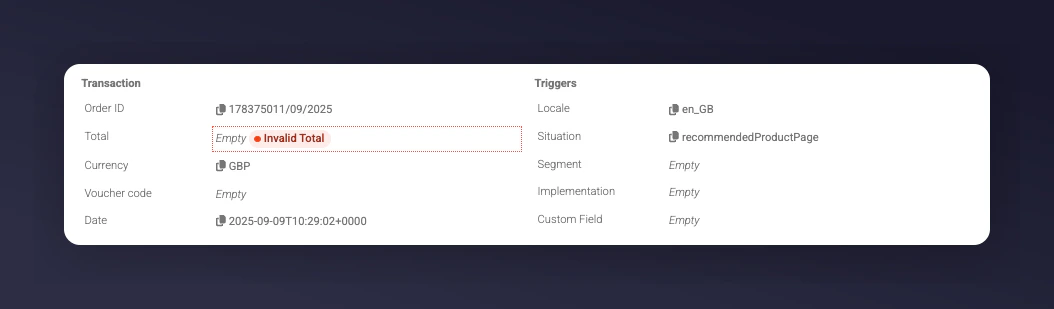 These may appear as errors but are often just warnings.
Undefined Values
Undefined means the data should be there but isn’t. This may indicate a problem with your data layer. Confirm you’re referencing the correct object or variable to pull values into the tag.
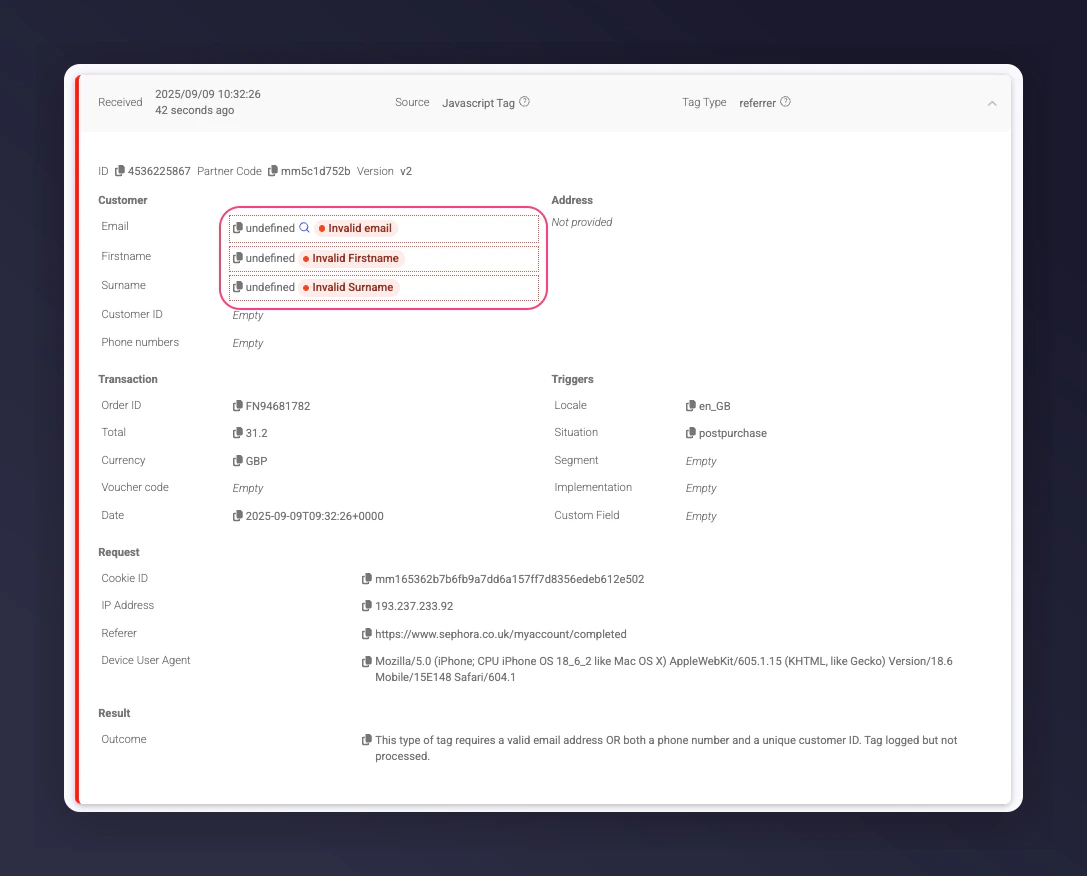 Always investigate undefined customer details or attributes like situation or locale. These are critical for ensuring users see the correct referral offer.
Help with Problem Logs
If you see an issue, raise a ticket using the Help with Tech form. Include filtered URLs, specific tag names or order IDs, screenshots, and steps to reproduce the problem. Last modified on March 19, 2026