A/B testing is the most effective way to improve referral programme performance. Whether you’re testing imagery, rewards, copy, or CTA buttons, Mention Me’s A/B system helps you experiment, learn, and grow.
On average, 5 A/B tests result in a ~60% boost in campaign conversion and 4x more referrals over six months.
What is A/B testing in Mention Me?
A/B testing shows different variants of a referral experience to different customer groups, allowing you to identify what performs best. You might compare:
- 10% vs. £10 off
- Image A vs. Image B
- Button colour variations
- Tone of voice in share messaging
Key benefits:
- Boost metrics like share and conversion rate
- Understand preferences across customer segments
- Test any element across the referral journey
- Build insights over time to drive sustained gains
How we determine a winner
Our system uses Bayesian modelling, not traditional statistical significance. It evaluates:
- Probability to be best — how confident we are in a variant’s performance
- Pre-set confidence thresholds to conclude tests
Tests auto-end after 8 weeks or when a winner is found earlier.
Why we don’t use traditional significance
We focus on probability-based evaluation to:
- Run faster tests
- Support low-volume campaigns
- End underperforming tests early
Metrics
- Variation Conversion Rate (default): best for high volumes, measures purchasing behaviour directly
- Variation Share Rate: useful for low-volume campaigns to evaluate share behaviour
Conversion Rate is preferred where viable, as it correlates directly with revenue. See Understanding Variation Metrics for detail on how these are calculated.
Planning your A/B test
1. Start with a clear objective
Examples:
- “Will fewer share methods improve share rate?”
- “Is £10 off more effective than 10% discount?”
- “Does urgency-focused messaging improve referee purchases?“
2. Isolate one variable
Test one change at a time to keep insights measurable and actionable.
3. Check your volume
We’ll help you select the right metric and testing conditions based on your referral traffic. For very low volumes, we may suggest best-practice alternatives.
How long do tests run?
- Maximum duration: 8 weeks*
- Most winners found within 4 weeks
- Faster tests use lower confidence thresholds
- Slow tests allow for more confident decisions
What happens when tests conclude?
At the end of a test, results are evaluated and your chosen action is applied:
- A winner is found: that variant is promoted
- No clear winner: default to Control (can be changed)
- Probability difference but low confidence: the higher-performing variant is promoted by default (can be adjusted)
When and why tests may end early
- Clear winner emerges: test ends early, variant promoted
- No meaningful difference: test ends early to save time and refocus efforts
Build a testing roadmap
Continuous testing is key. Plan experimental cycles based on data and hypotheses:
| Month | Test Idea | Hypothesis |
|---|
| January | Test headline tone | Friendly tone will boost engagement |
| February | Simplify copy | Shorter text increases conversion |
| March | Change reward | Higher-value incentive drives more shares |
Excluding unconcluded experiments from value calculations
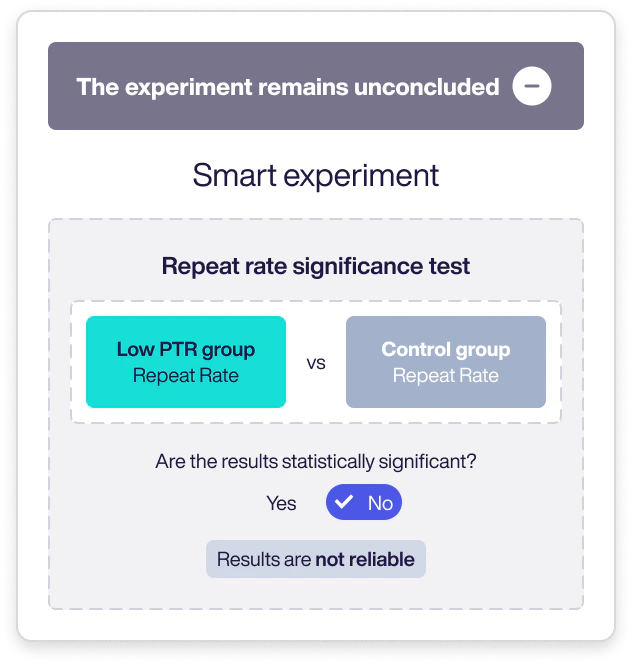
When evaluating the impact of Smart Experiments, experiments that remain “unconcluded” (those without a statistically significant difference between test groups) are excluded from overall value calculations.
What is an unconcluded experiment?
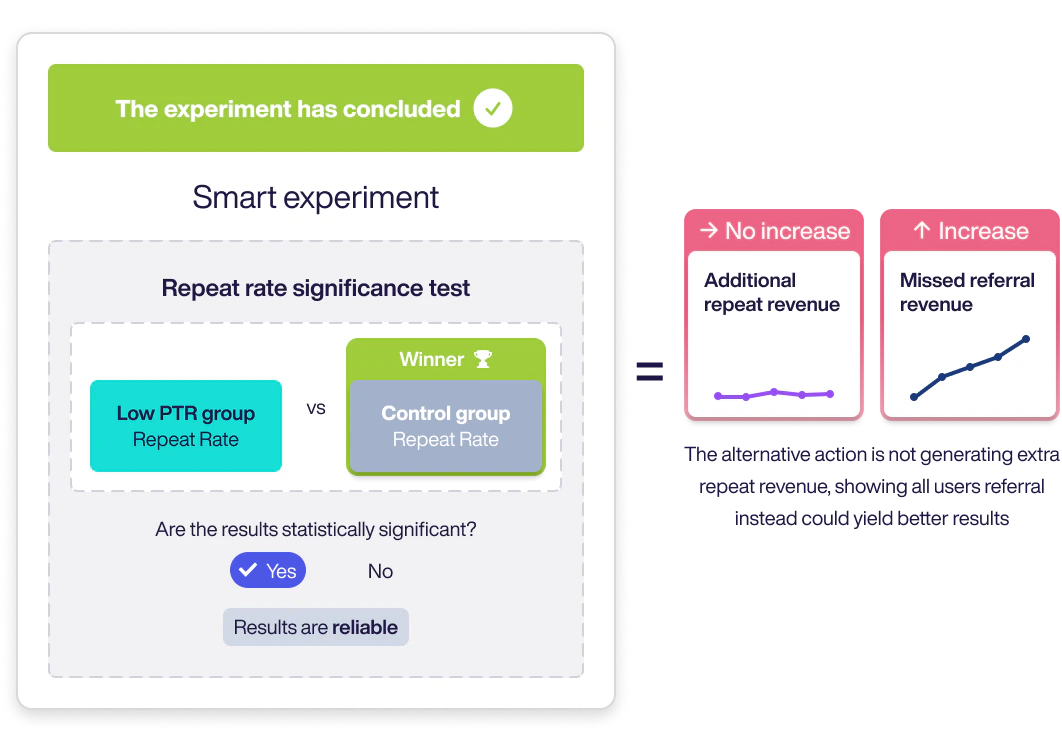
To evaluate a Smart Experiment’s value, we compare test groups using the Repeat Rate Significance Test to determine if results are statistically meaningful.
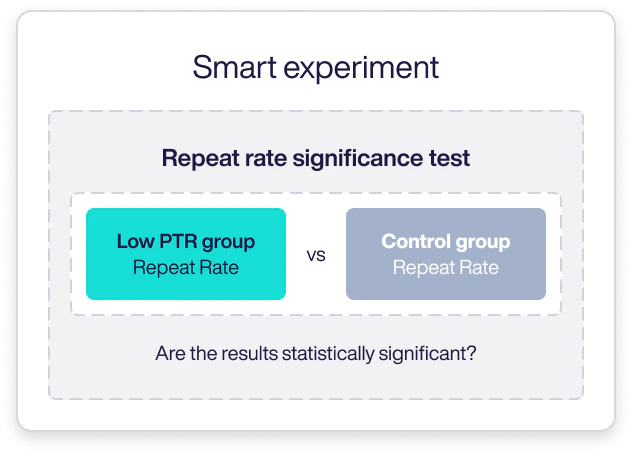 The Repeat Rate is the rate at which customers make a second purchase. The test determines whether any difference observed between the Control Group and Low Propensity to Refer group is statistically valid and not due to chance.
Only when this difference is statistically significant do we consider the experiment “concluded”.
The Repeat Rate is the rate at which customers make a second purchase. The test determines whether any difference observed between the Control Group and Low Propensity to Refer group is statistically valid and not due to chance.
Only when this difference is statistically significant do we consider the experiment “concluded”.
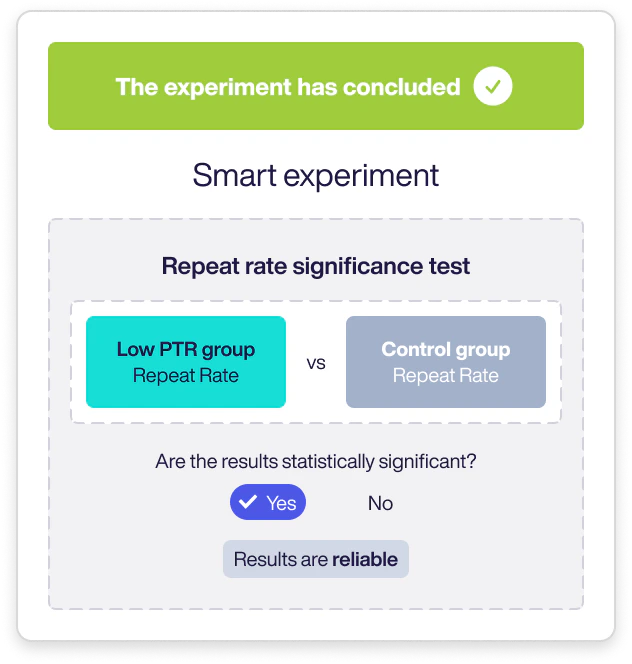 Experiments without statistically significant differences remain “unconcluded”.
Why unconcluded data can’t calculate incremental value
Impact on Repeat Revenue
To determine repeat revenue generated by showing an alternative offer to the Low Propensity group, we compare its repeat rate to the Control group’s. If a test is unconcluded, no significant difference means we can’t confidently calculate additional repeat revenue.
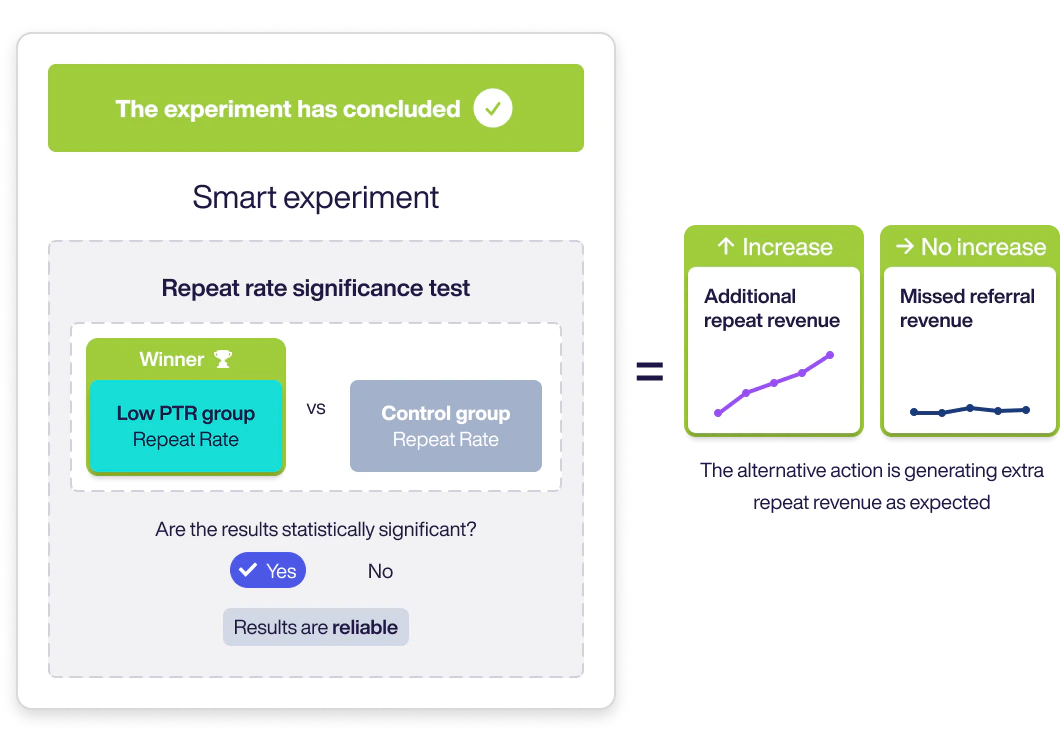
When a test does conclude:
- If Low Propensity wins: additional repeat revenue was driven by showing the alternative offer.
- If Control wins: showing referral to everyone would have driven more repeat revenue.
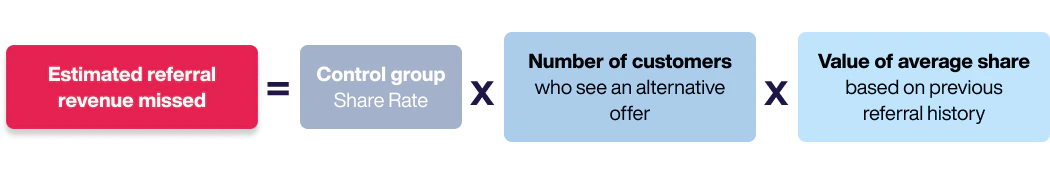
 Impact on Estimated Referral Revenue Missed
To assess the value lost by not showing referral, we use:
Impact on Estimated Referral Revenue Missed
To assess the value lost by not showing referral, we use:
- Share rate of the Control group
- Number of customers shown the alternative offer
- Historical average value of a share
 Why are unconcluded tests excluded from overall value?
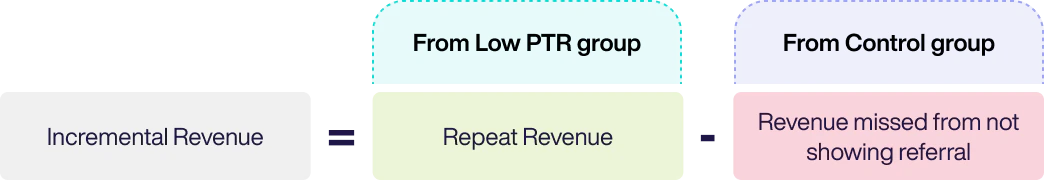
To calculate total incremental value, we subtract Missed Referral Revenue from Repeat Revenue Gained. If a test is inconclusive, we can’t calculate repeat revenue gained, and thus can’t confidently determine incremental value.
In such cases, we show only the missed revenue from referrals on the results dashboard.
Why are unconcluded tests excluded from overall value?
To calculate total incremental value, we subtract Missed Referral Revenue from Repeat Revenue Gained. If a test is inconclusive, we can’t calculate repeat revenue gained, and thus can’t confidently determine incremental value.
In such cases, we show only the missed revenue from referrals on the results dashboard.
FAQs
Why does the A/B Testing Dashboard show higher customer numbers than downloadable reports?
The A/B testing dashboard includes all customers who enrolled, including those who shared their name only. CSV reports only reflect customers who clicked to share a referral link.
To get a full list of enrolled customers, contact your Client Success Manager. Learn more about automatic post-purchase enrolment here.
Note: Some tests may take 12 weeks due to cooling-off requirements (e.g. approval delays or refund windows). Last modified on March 18, 2026