

Planning Your A/B Test
Test One Thing at a Time
Focus on a single variable - imagery, copy, or incentive type - to ensure you can isolate the cause of any performance changes.- Test 7-day vs. 14-day validity periods
- Test branded vs. lifestyle imagery
- Avoid changing both incentives and visuals at once
Prioritise What to Test
- Impact: Will the change likely drive major results?
- Ease: Is it quick and simple to implement?
- Volume: Do you have enough traffic to support a test?
Always Be Testing
Treat A/B testing as an ongoing optimisation process. Continually test and iterate to find new insights.Promote Your Referral Programme Widely
- Ensure both test variations get equal exposure
- Include referral promotions in emails, homepage, and post-purchase flows
Common Pitfalls to Avoid
- Avoid testing too many things at once
- Don’t stop the test too early
- Act only on results from completed tests
- Don’t cherry-pick data - look at the full picture
Test Templates
The templates below are sorted by effort and impact level. Use them to identify what drives the greatest performance uplift.Reduce Share Methods (Lower Effort)
Test name + native + link vs. offering all share methods. Result: +43% Share Rate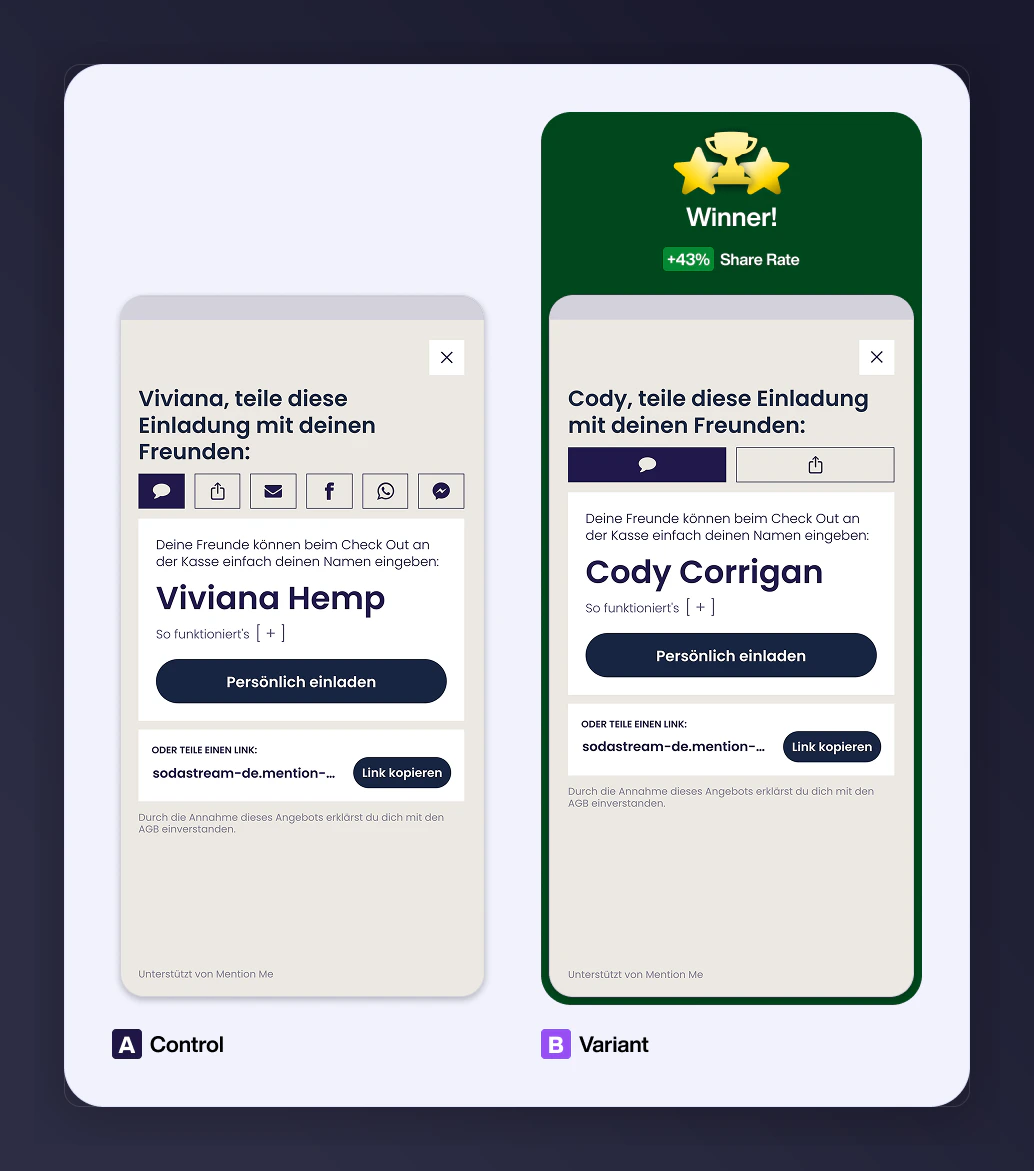
The reduced share methods test increased share rate by 43% compared to offering all share methods.
Remove Meta Sharing (Lower Effort)
Remove Facebook and Messenger in favour of higher-performing options. Result: +14% Share Rate, +18% Conversion Rate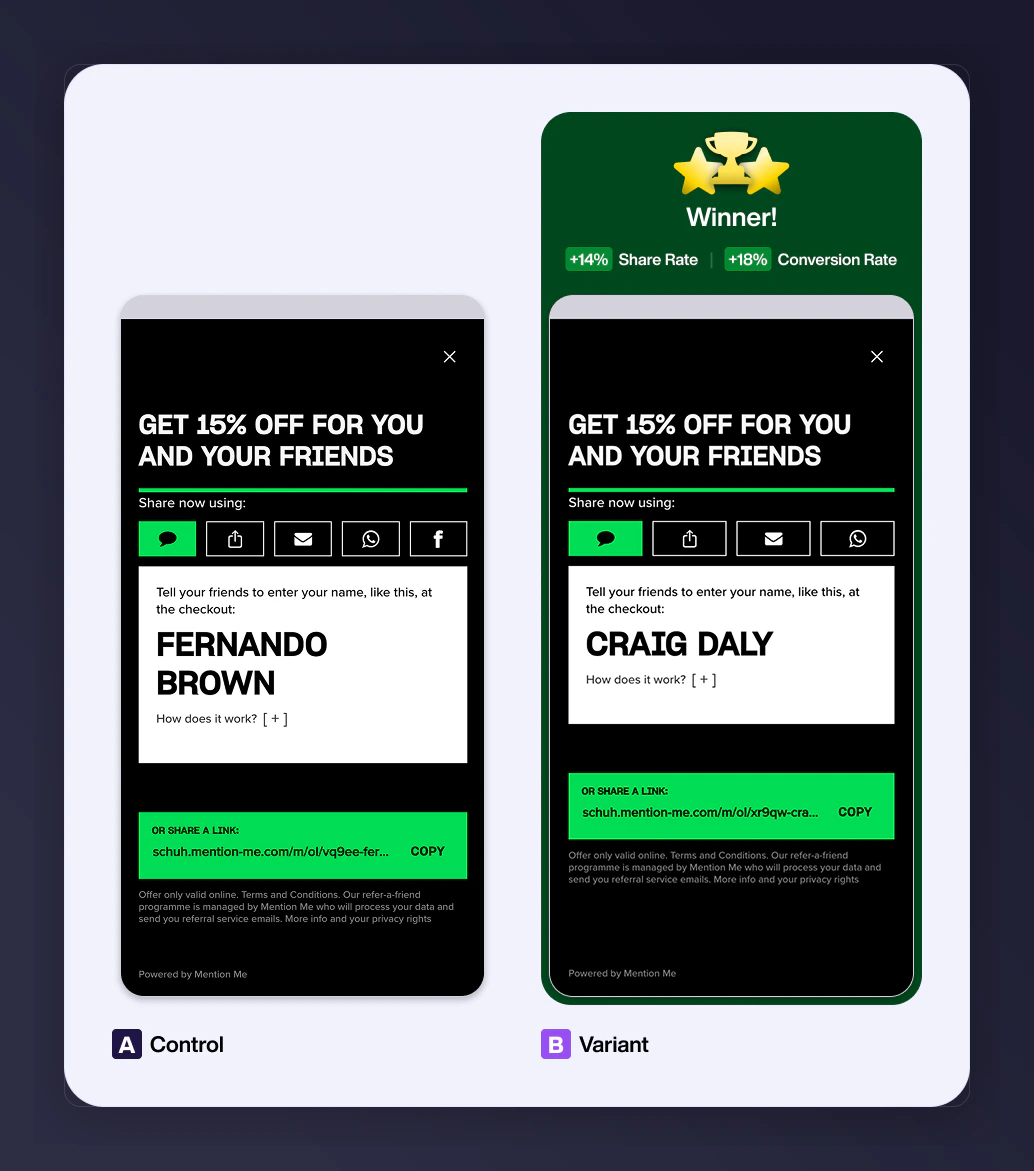
Removing Facebook and Messenger sharing increased share rate by 14% and conversion rate by 18%.
Add WhatsApp Sharing (Lower Effort)
Add WhatsApp to the mobile share options. Result: +24.5% Share RateReward Framing: Give vs. Get (Lower Effort)
Test CTA: “Give 20% Off” vs. “Get 20% Off”. Result: +12% Share Rate when “Give” used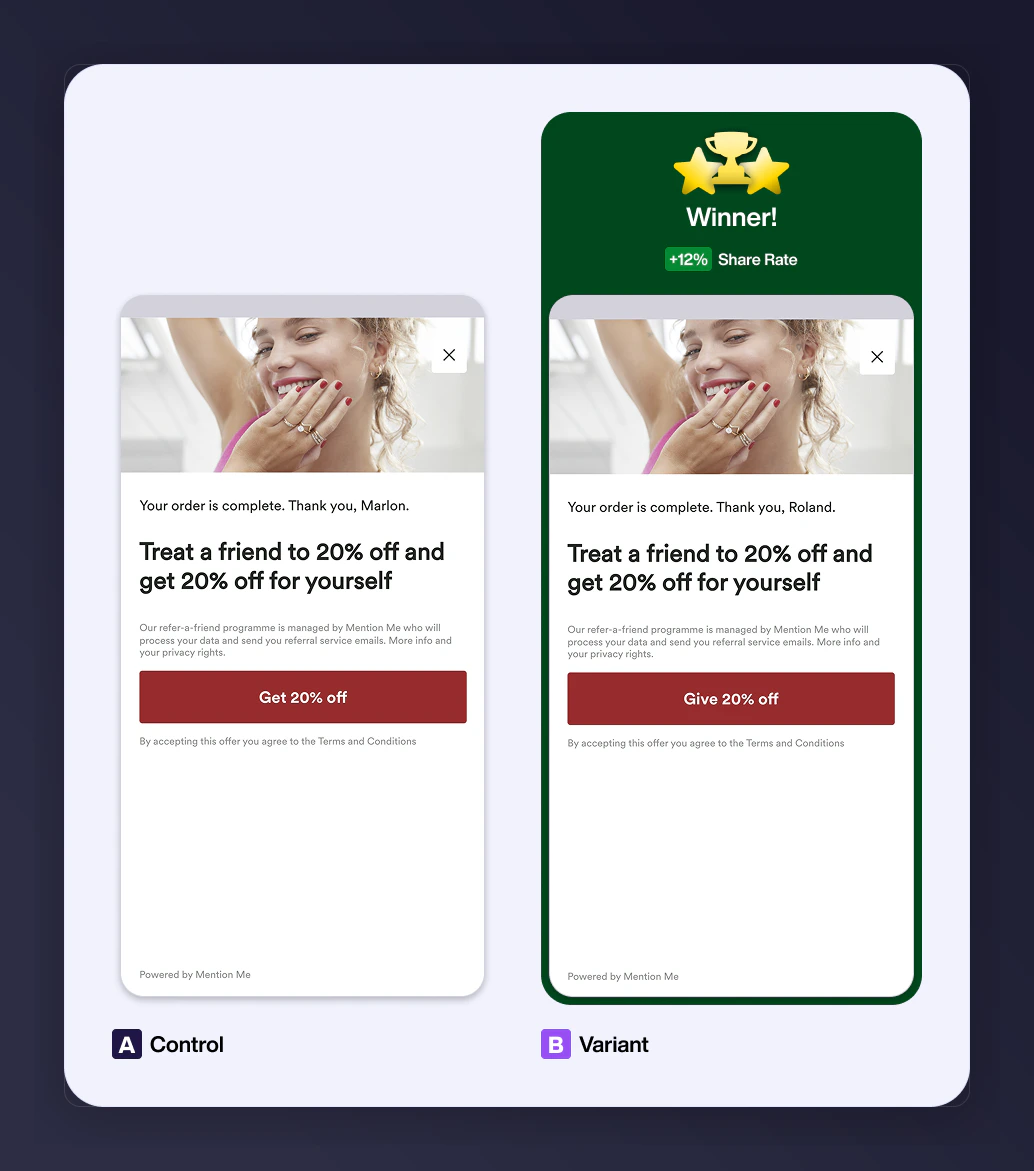
Framing the reward as Give rather than Get increased share rate by 12%.
Add Brand USPs (Lower Effort)
Highlight brand strengths to add motivation. Requires copy changes on referrer page, corner peel, and messaging.Lifestyle vs. Product Imagery (Higher Impact)
Lifestyle (social scenes) vs. product-only images. Result: +21% Share Rate and +5% Conversion Rate with product focus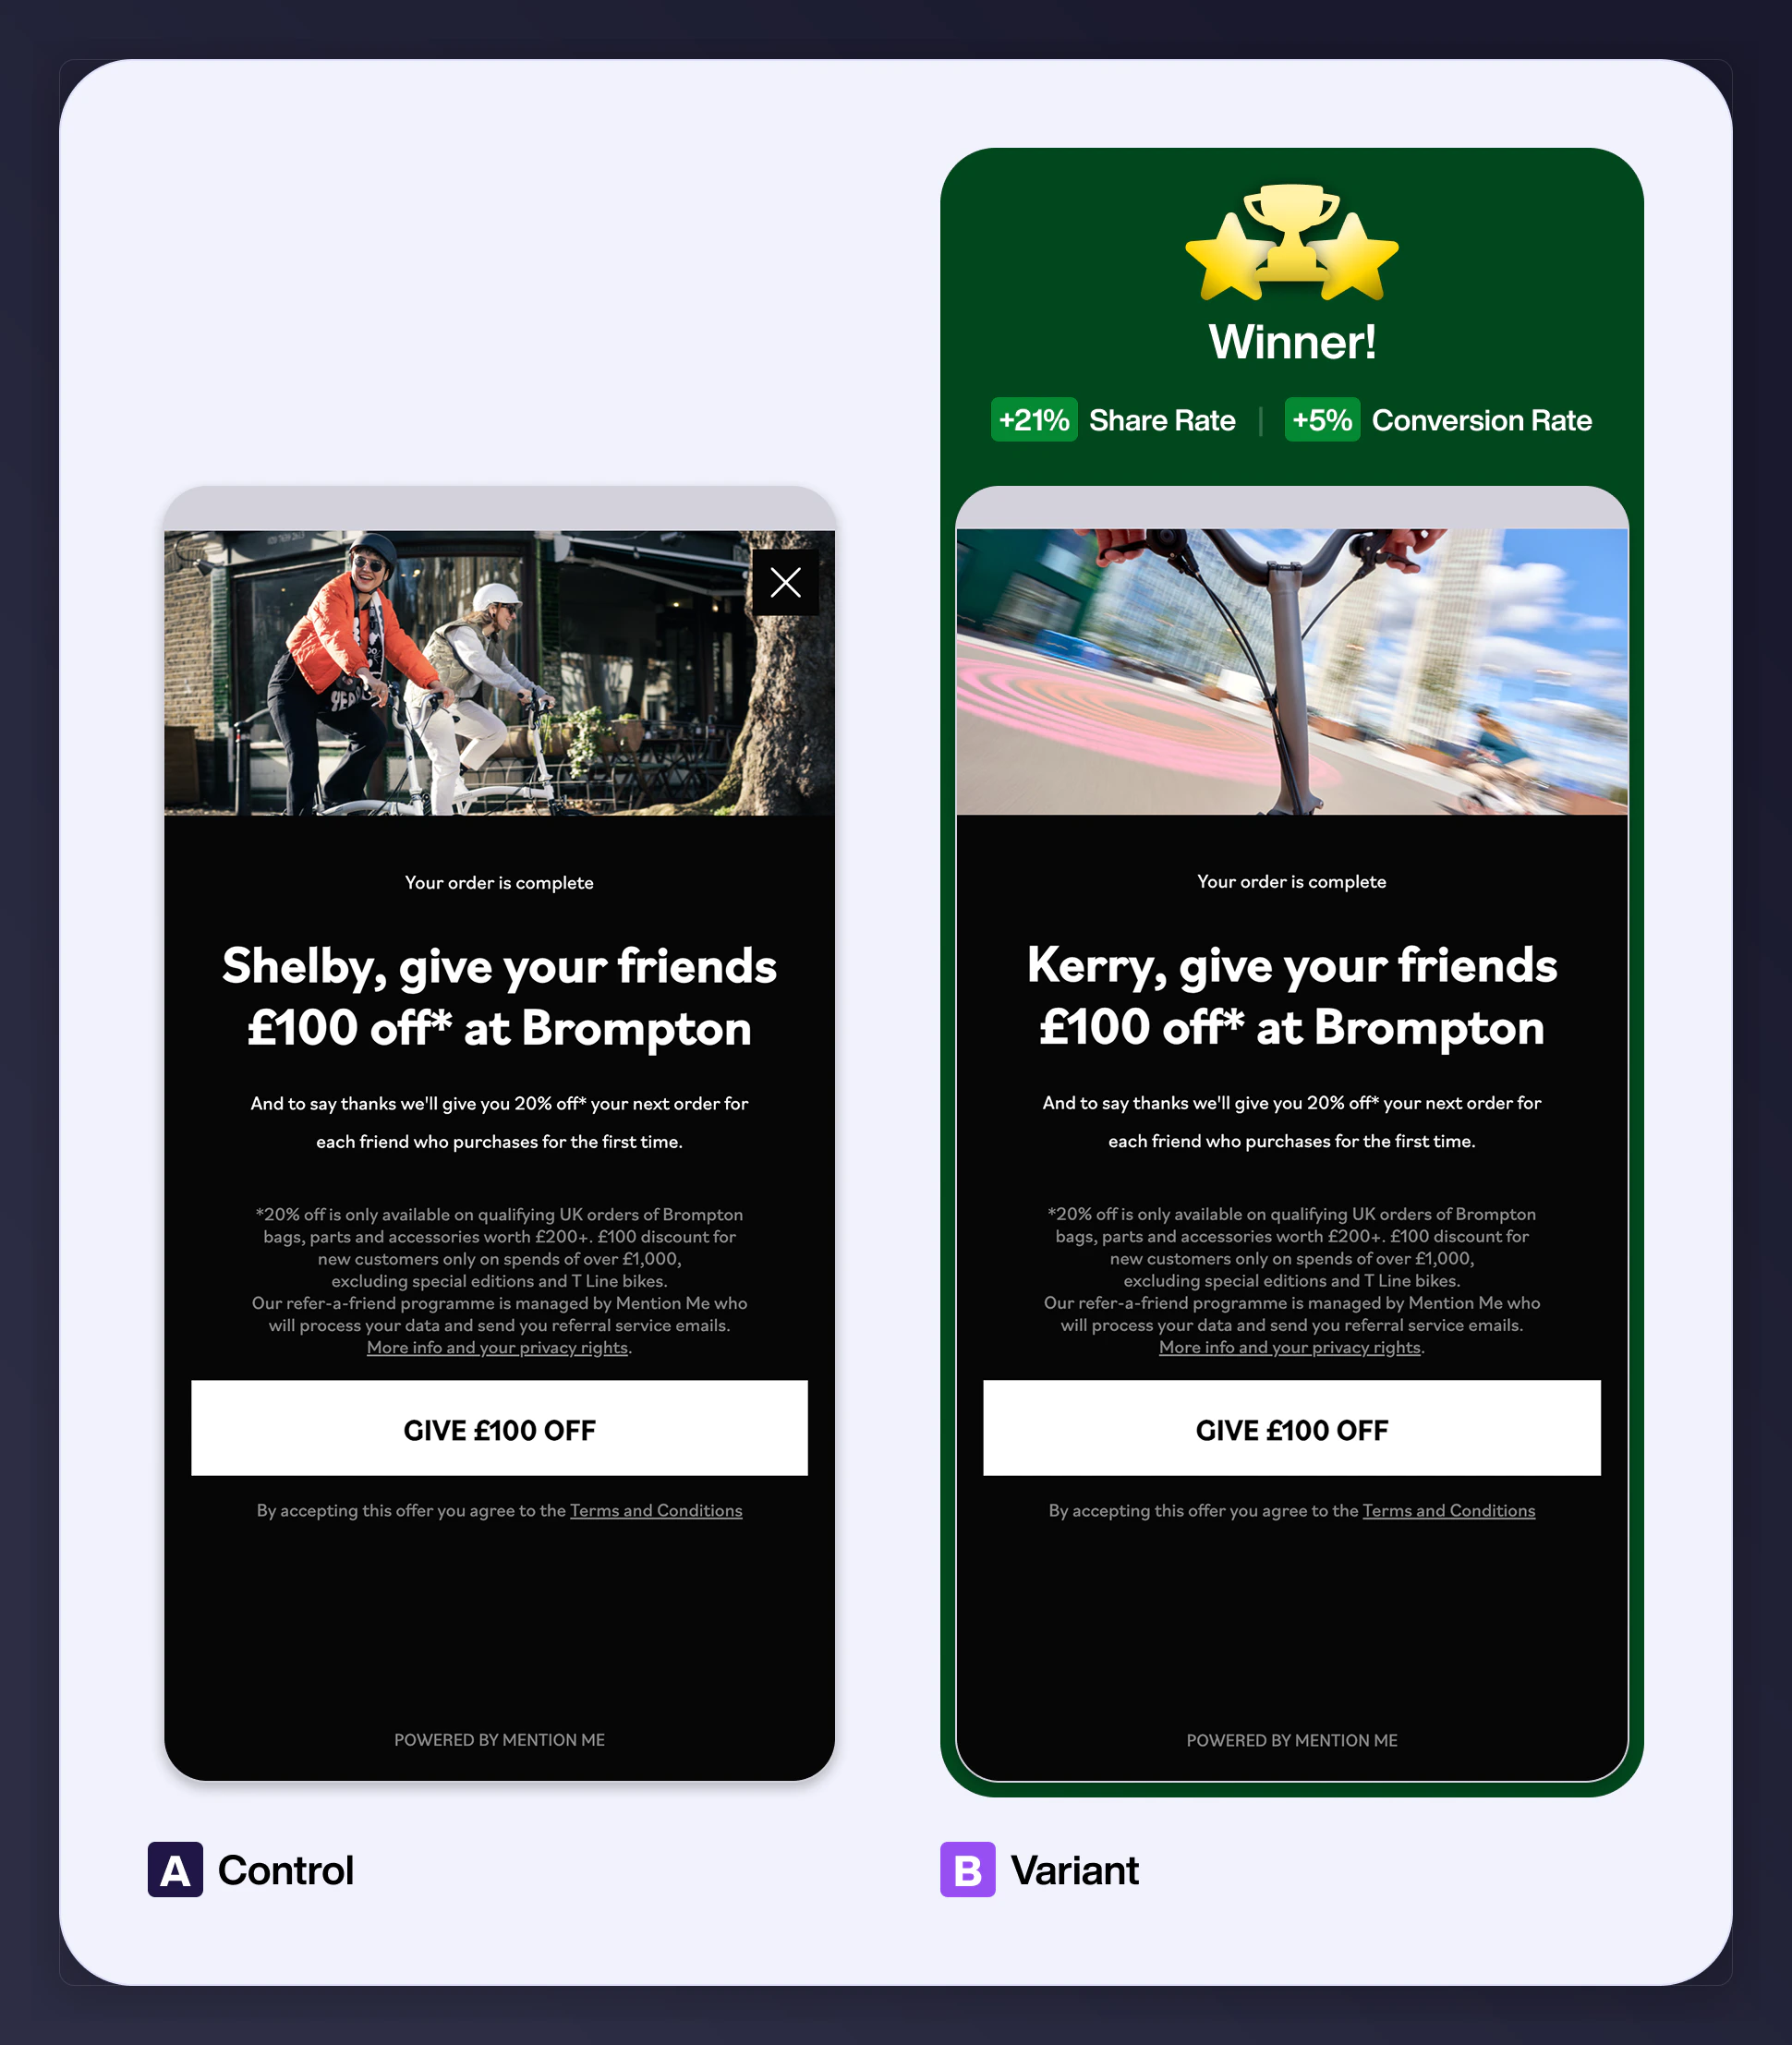
Product-focused imagery increased share rate by 21% and conversion rate by 5% compared to lifestyle imagery.
Lifestyle vs. Reward Focus Imagery (Higher Impact)
Ideal for service-led brands.Money vs. Percentage Off (Higher Impact)
Example: £20 off vs. 55% discount (min £30 spend). Result: +20% Share Rate and +100% Purchase Rate for % discount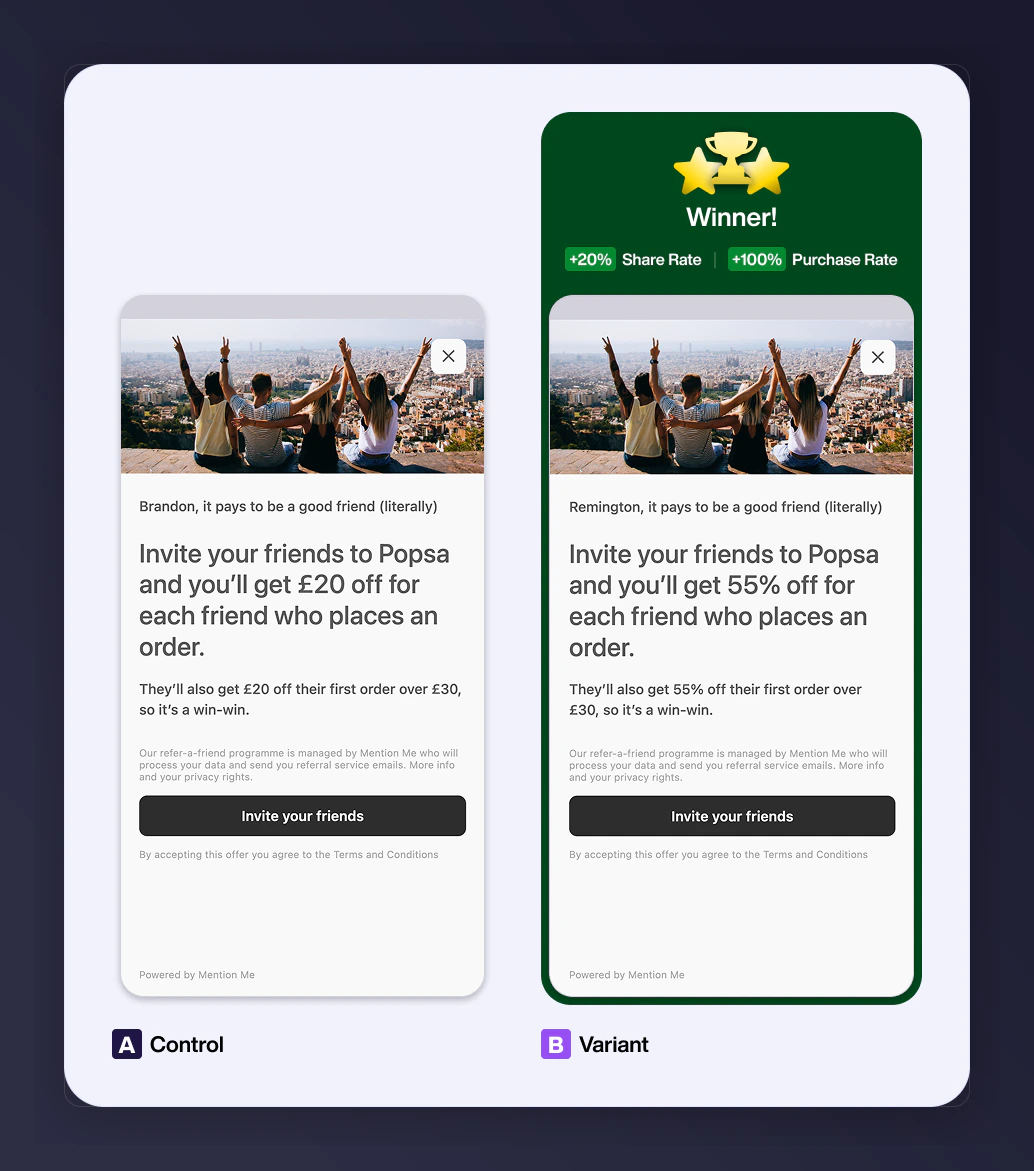
Offering a percentage discount increased share rate by 20% and purchase rate by 100% compared to a fixed amount off.
Reducing Reward Value (Higher Impact)
Test reward value sensitivity to optimise ROI.Adjusting Minimum Spend (Lower Effort)
Test with vs. without minimum spend requirement. Result: +45% Share Rate when removed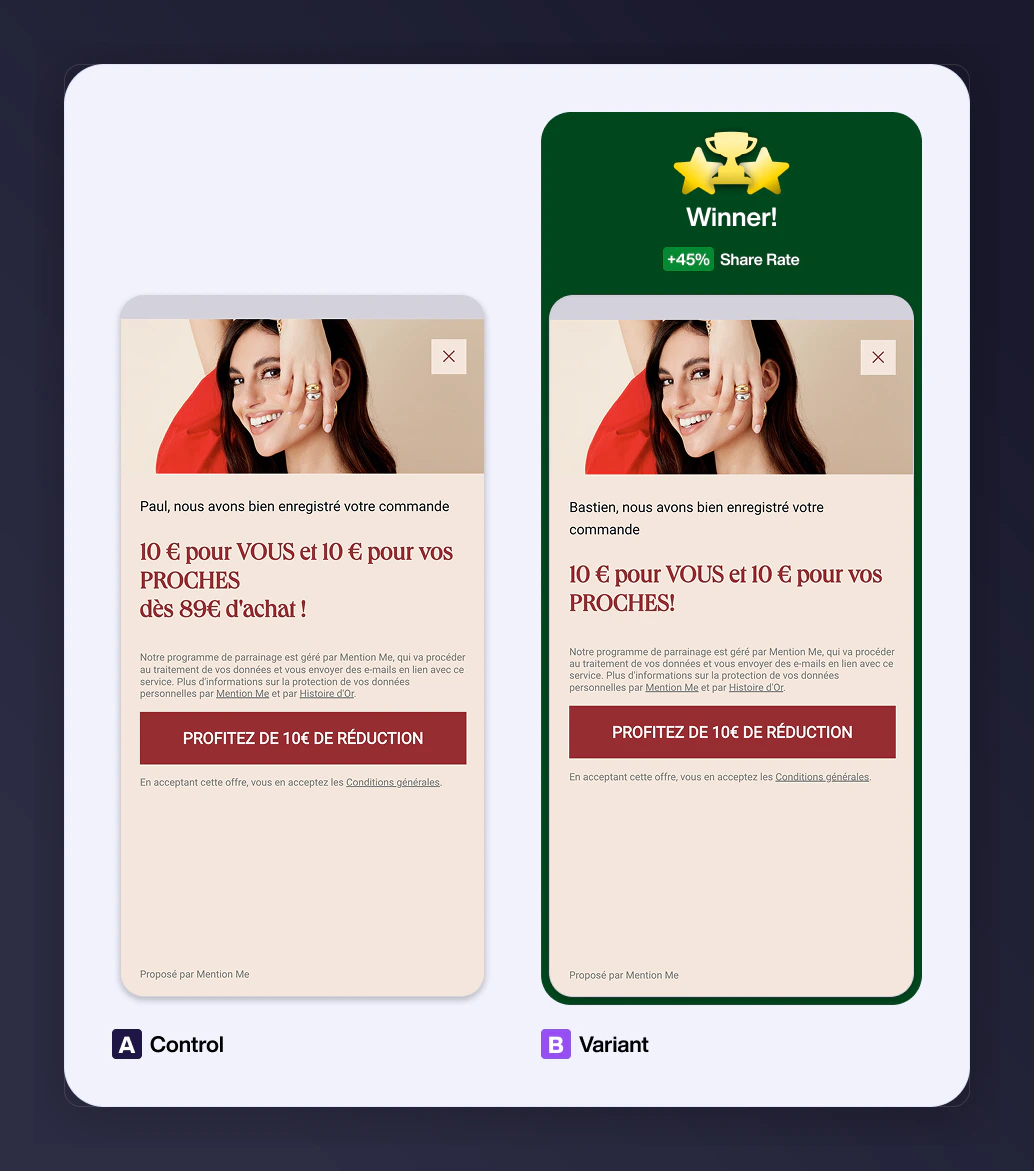
Removing the minimum spend requirement increased share rate by 45%.
Shorten Offer Validity (Lower Effort)
Increase urgency by reducing offer duration. Result: 3-day expiry vs. 7-day - +28% Purchase Rate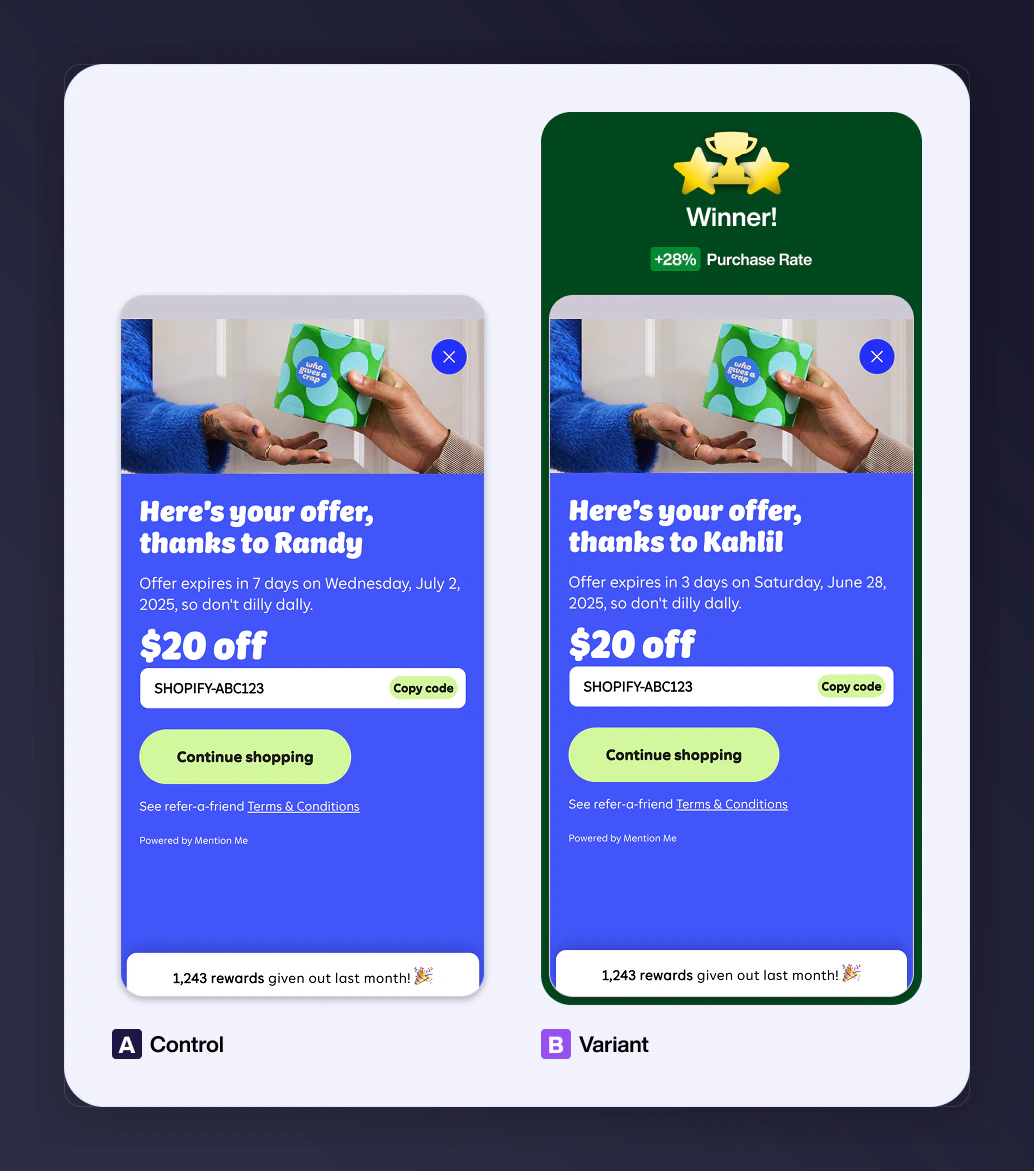
A 3-day offer expiry increased purchase rate by 28% compared to a 7-day expiry.
Extend Offer Validity (Lower Effort)
Beneficial for high-consideration purchases.Referral Best Practice (When A/B Testing Isn’t Feasible)
Even without formal A/B testing, you can analyse and optimise your programme using funnel data, benchmarking, and engagement metrics.Understand the Referral Funnel
- Customer purchases and sees referral prompt
- Refers a friend
- Friend clicks the link and visits your referral page
- Friend registers to redeem the offer
- Friend completes a purchase
- Referrer receives the reward
Optimise Using Benchmarking and Explore
Use the Benchmark tab under Performance to compare your funnel metrics against the industry average and see where to focus first. For a full breakdown of each metric and targeted test ideas, see Understanding Referral Intelligence Benchmarks. Explore section analysis dimensions:- Promotion point (e.g. homepage vs. post-purchase)
- Share method (WhatsApp, Name Share, etc.)
- Audience segment
- Device (mobile vs. desktop)
Practical Optimisation Tips
1. Maximise promotion points- Use homepage banners, corner peels, and email placement to ensure visibility
- Email campaign examples:
- +107% Share Rate from Solus email launch
- +336% Referrals from Valentine’s Day promo
- 50% Open Rate with targeted reminder email
- Enable native share buttons
- Allow message personalisation
- Encourage multiple shares per referrer
- Use social proof (e.g. Trustpilot)
- Highlight key USPs at every touchpoint
- Offer exploration CTAs
- Test offer duration for urgency impact
- Use “situation” tags to track performance by placement
- Run cohort or device-type analysis
- Link referral journeys to customer value outcomes