

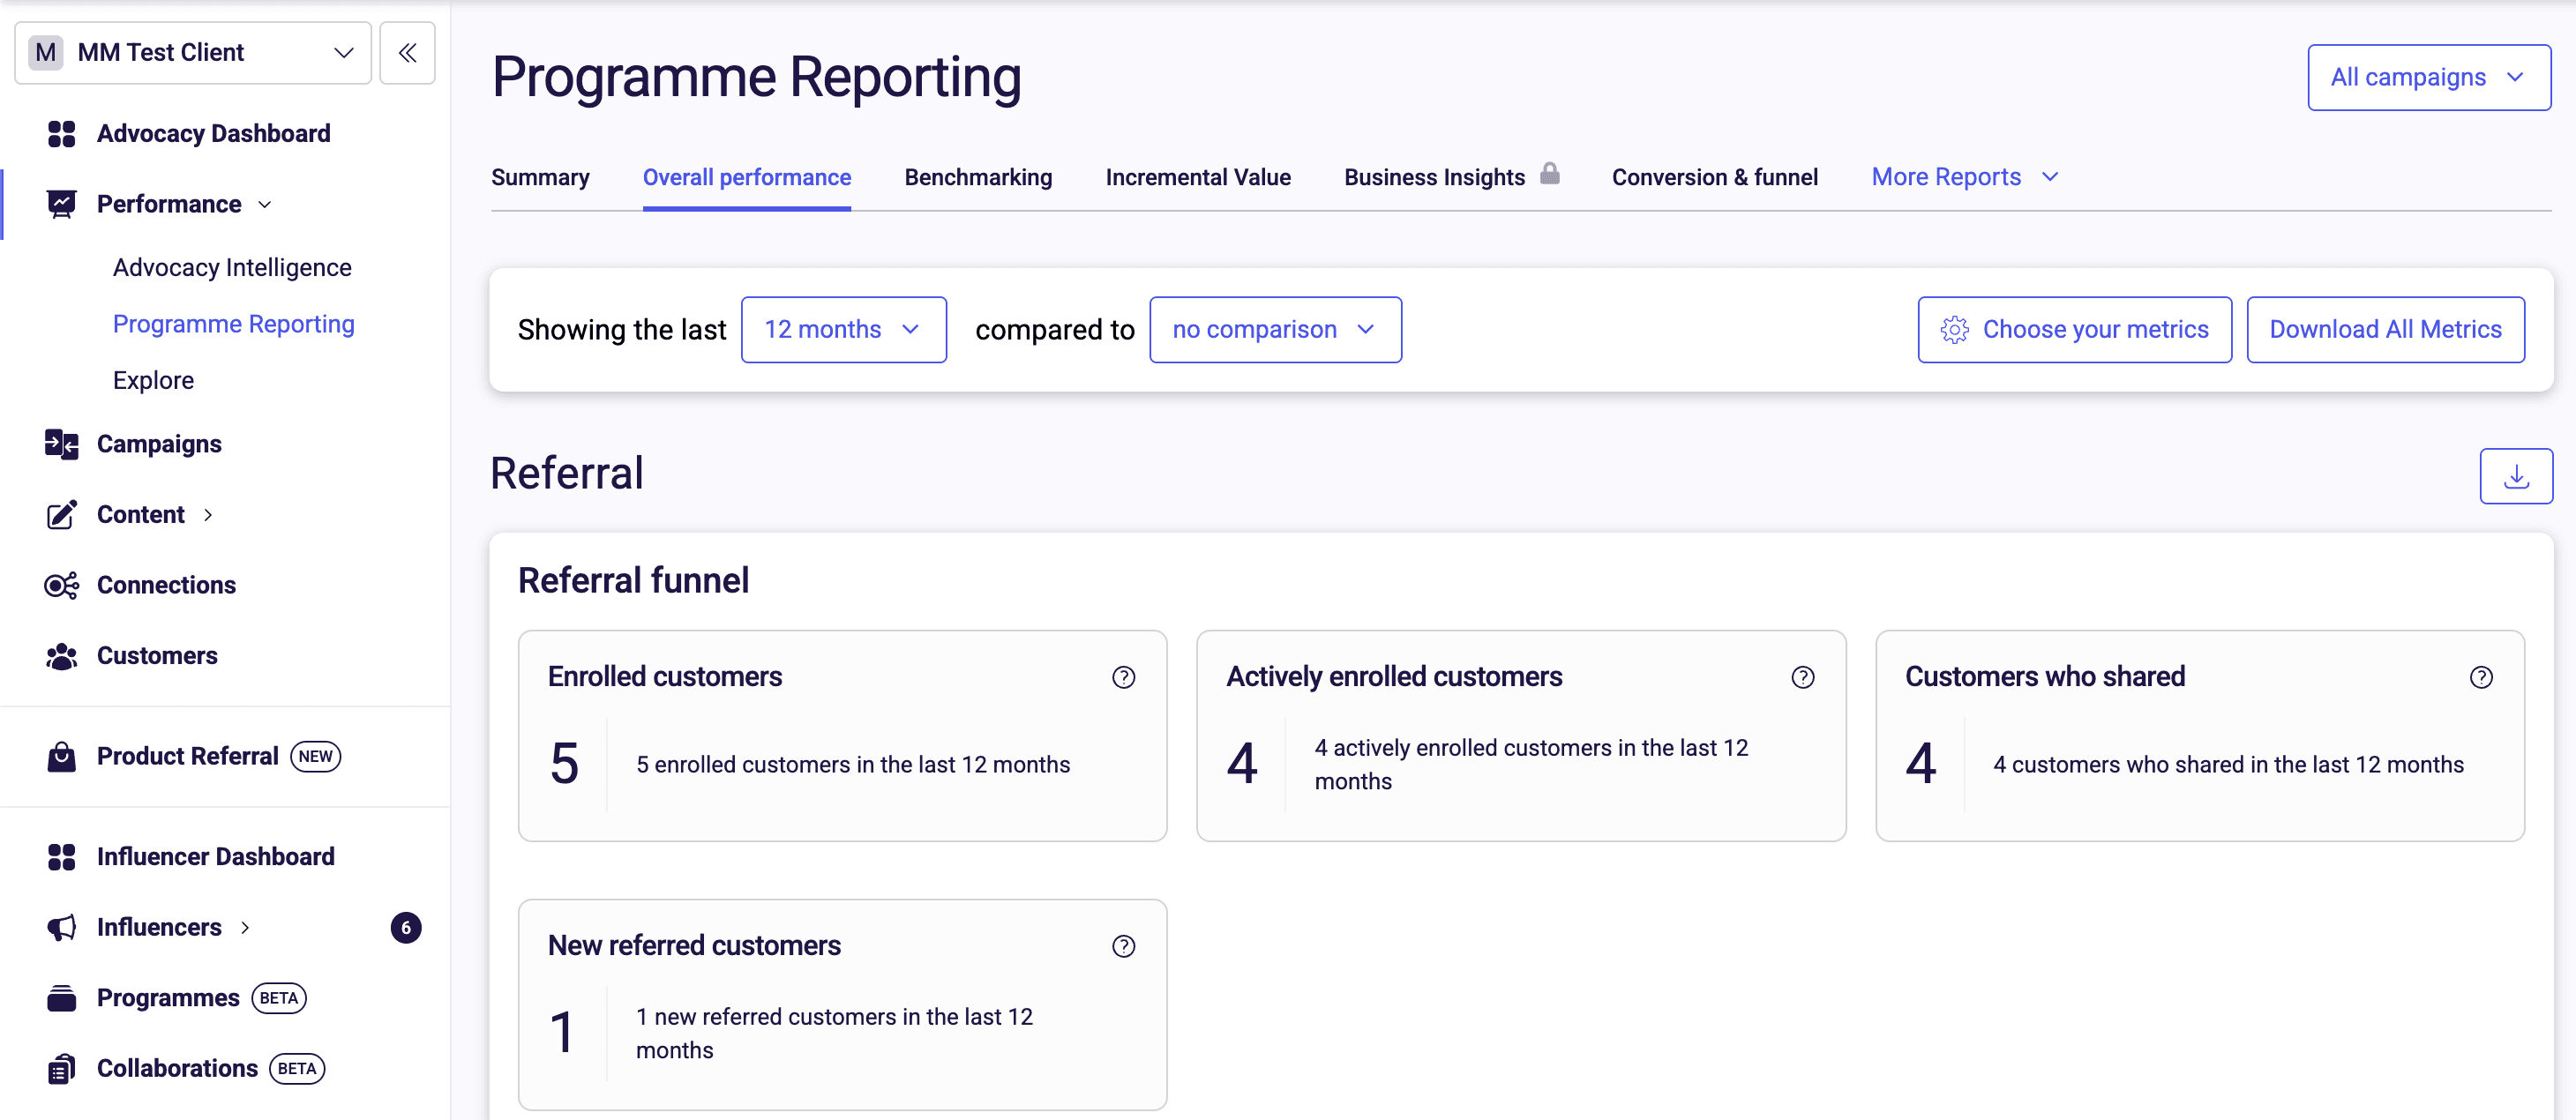
The Overall Performance report, showing the campaign selector, date picker, and default metric set.
- A campaign selector, so you can view all campaigns together or filter down to one (for example, if a merchant runs separate UK, France, and Spain campaigns)
- A date picker, with preset windows or the option to enter a custom date range
- The ability to add a comparison to any metric, either against the prior year or the prior period (the equivalent number of days immediately before your selected window)
- A metric selector, so you can add or remove metrics from the default view
The Referral Funnel: End to End
The most useful way to read these metrics is end to end, as a funnel: each metric represents a stage further along the referral journey, from a customer seeing a referral offer through to a new customer completing their first order.
A few of these are worth explaining further.
Unique Impressions vs Impressions
Impressions and unique impressions are similar, but impressions are not deduplicated. If a customer refreshes the page showing the referral popup three times, that counts as four impressions but only one unique impression. Because unique impressions ties activity to unique sessions rather than counting every page load, it’s the more reliable of the two metrics to use.Enrolled Customers vs Actively Enrolled Customers
At the post-purchase point, Mention Me automatically captures a customer’s name and email address and registers them for referral without any action from the customer. This is called a silent enrolment. Enrolled Customers is the combined total of:- Customers who were silently enrolled at post-purchase
- Customers who actively enrolled, either by clicking through the post-purchase overlay or by manually registering on a landing page or dashboard
Customers Who Shared can be under-reported. If a referrer tells a friend about a discount in conversation rather than through a formal share, that activity isn’t automatically captured. If the referee later enters the referrer’s name at checkout, Mention Me retrospectively credits that share.
Revenue Metrics
The revenue metrics build on top of the funnel to show the financial impact of referral.
Total Referral Revenue is the headline figure typically shared with a client: for example, “over the last 30 days, Mention Me generated you £17,000, made up of £5,000 from new customer revenue, £12,000 from referees’ subsequent orders, and a small amount from rewarded referrers.”
At onboarding, clients are asked to share order values net of discounts and VAT, so revenue metrics should reflect revenue before discount. In practice, clients don’t always set this up correctly on their side.
Revenue From Rewarded Referrers has no direct link to the referrer’s reward itself - it simply measures whatever the referrer spent within 45 days of receiving it. For clients whose referrer reward is a small, fixed-value gift card (for example, a £20 Amazon voucher from an insurer), this metric may not be especially meaningful, since the reward isn’t tied to a purchase.
Conversion Metrics
Conversion metrics express the funnel above as ratios. Share Rate is Customers Who Shared as a percentage of Enrolled Customers. For example, a merchant with 35,000 enrolled customers and 1,600 who shared has a share rate of roughly 5%. Purchase Rate is Referee First Orders as a percentage of shares. For example, a merchant generating 100 new customers from 1,600 shares has a purchase rate of roughly 6%. Conversion Rate is Referee First Orders as a percentage of Enrolled Customers, showing overall drop-off across the whole journey. Share Rate and Conversion Rate are both calculated from total Enrolled Customers, not from Actively Enrolled Customers. This is deliberate: both metrics are meant to show, of everyone who could share because they’ve been enrolled, how many actually did. Measuring from Actively Enrolled Customers alone would inflate the picture, since customers in that group have already shown intent to engage. As a rough guide:- A Share Rate of around 5% is acceptable; 10% is better
- A Purchase Rate of 20-30% is typical for a healthy programme
- A Conversion Rate of around 1% is a reasonable expectation
Average Order Value
New Customer AOV is the average value of a referee’s first order - Revenue From New Customers divided by the number of new referred customers. Non-Referred Customer AOV is the average order value of orders that weren’t placed as a result of referral. Comparing the two is a useful story to tell a client, even when referral volumes are modest. If New Customer AOV is consistently higher than Non-Referred Customer AOV, it shows that the customers referral is generating spend more, on average, than the merchant’s other customers.The Promotion Points Report
Alongside Overall Performance, the Promotion Points report shows where in the referral funnel activity is happening, broken down by touchpoint - for example, post-purchase, a banner in the account area, or a dedicated landing page. Touchpoints are tracked usingsituation parameters on referral URLs - see Promotion Points & Situation Parameters for how these are set up.
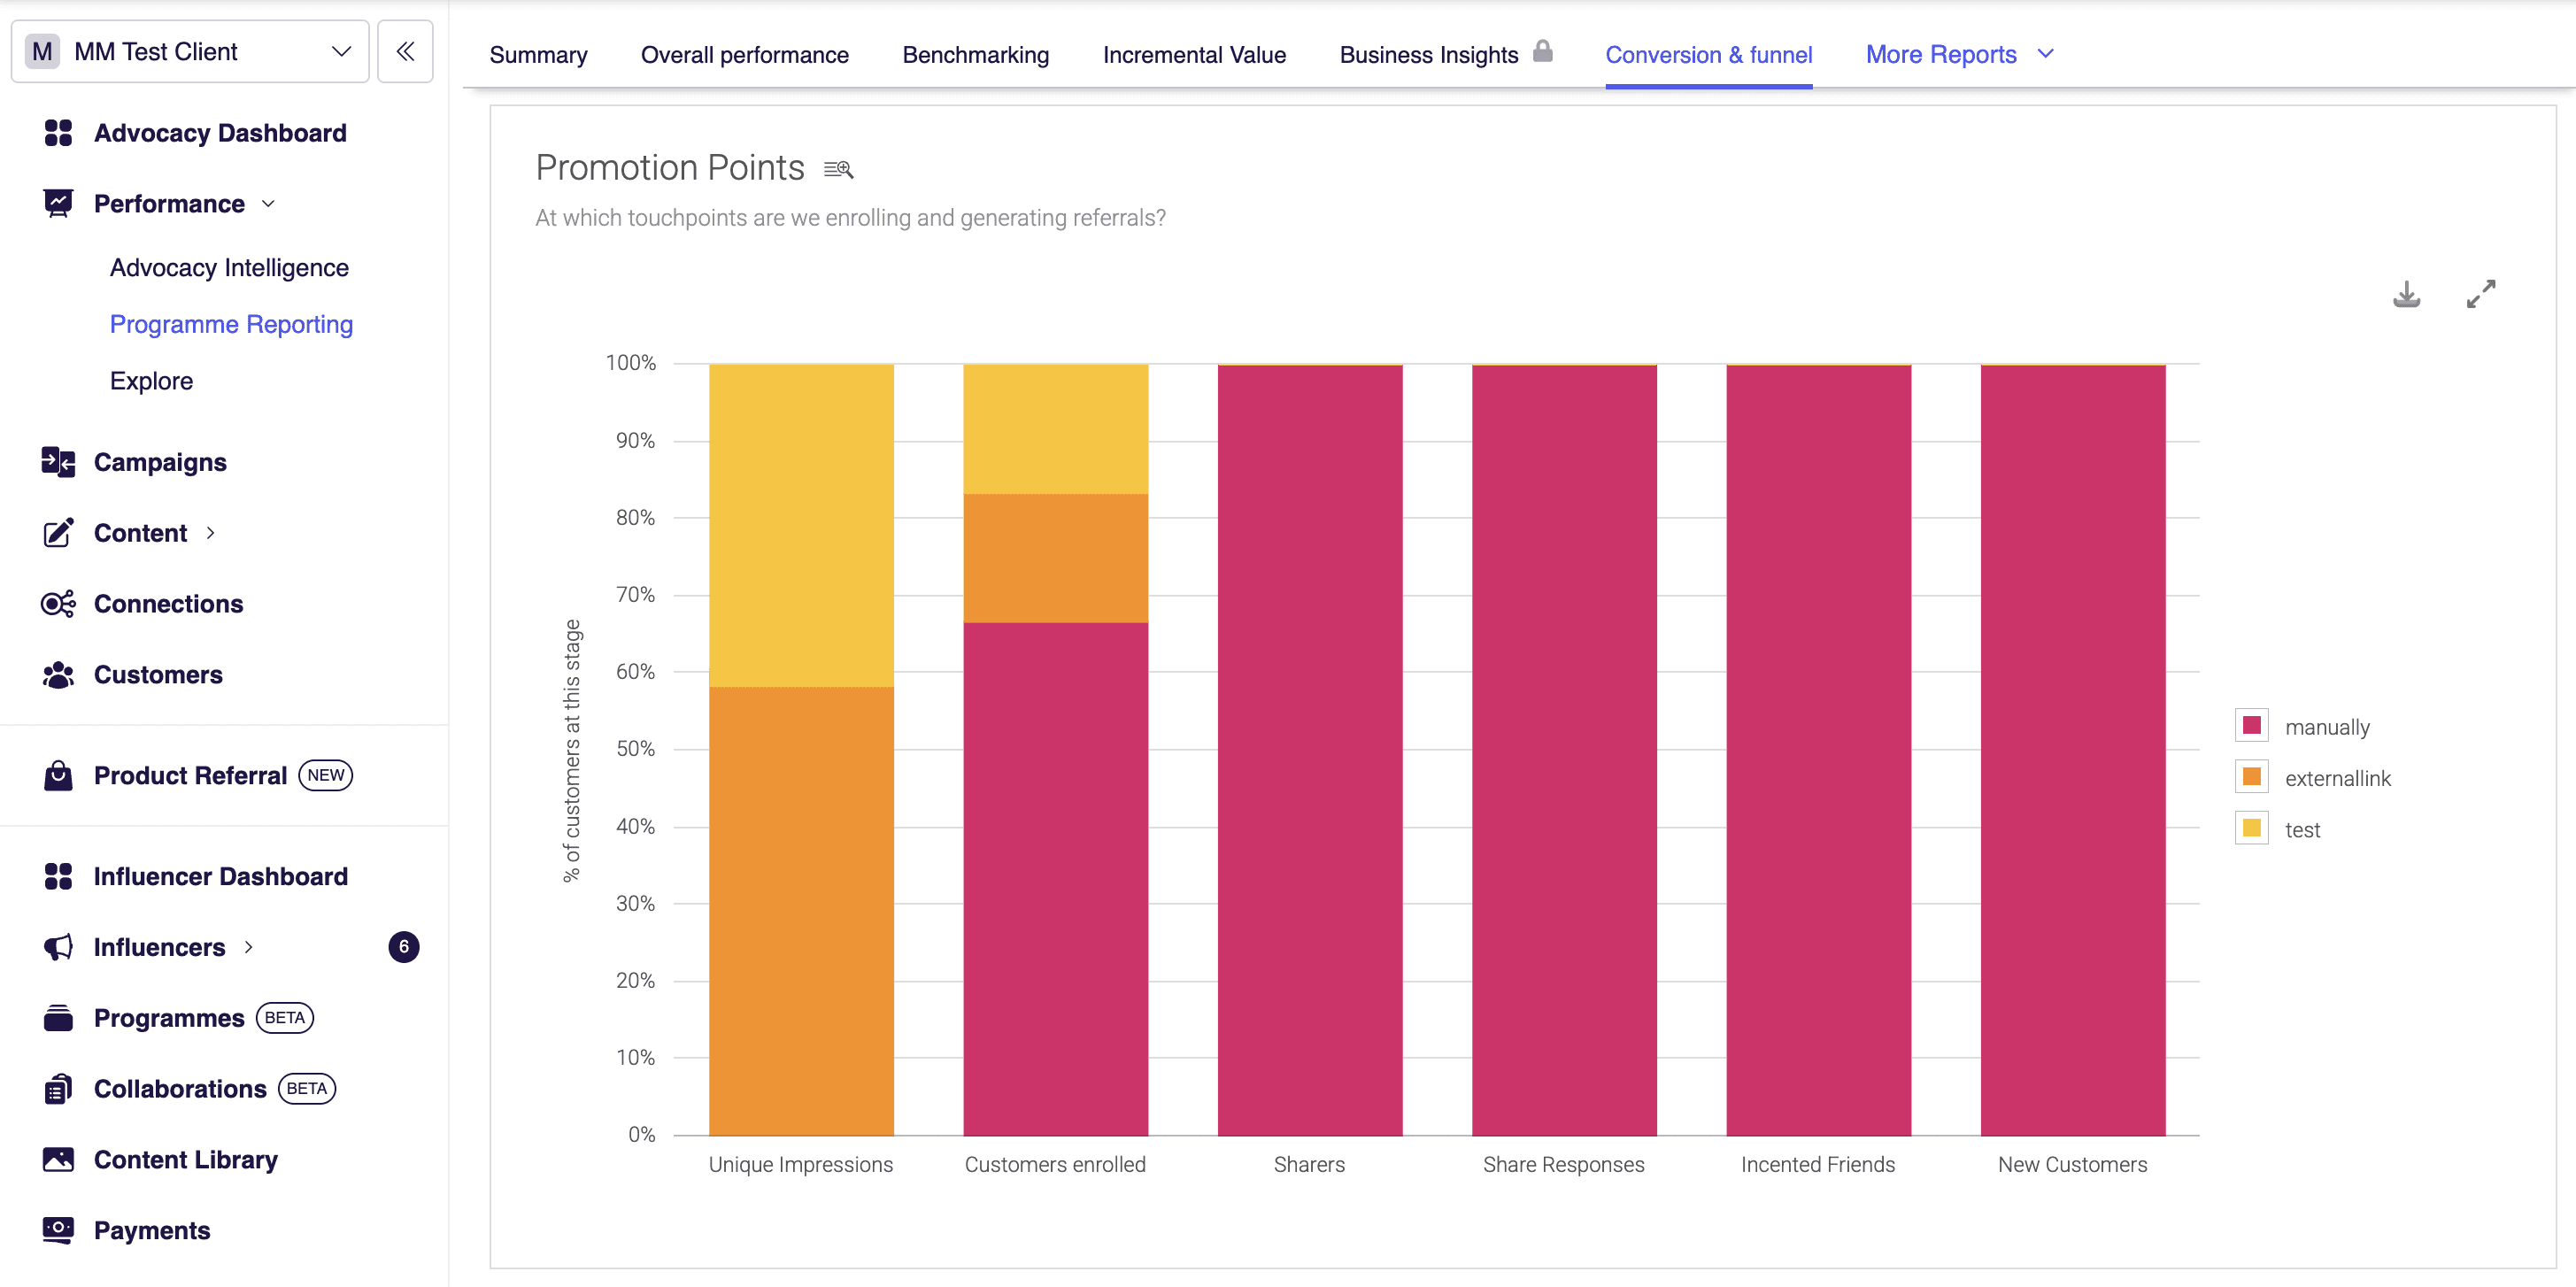
The Promotion Points report, showing funnel metrics broken down by touchpoint.
The Overall Performance report also includes a set of graphs, which visualise the metrics covered in this article over time.
See Also
Referral Metrics Glossary
Definitions for every metric tracked across the referral funnel, from impressions and enrolment through to conversions and revenue.
Understanding Referral Intelligence Benchmarks
Compare your funnel metrics against industry averages and find targeted test ideas for improving them.
How to Analyse Referral Data
Build custom reports in the Explore section and break performance down by promotion point, share method, and segment.
Promotion Points & Situation Parameters
Set up situation parameters on referral URLs so activity can be tracked by touchpoint.