Where to Find the Dashboards
The main navigation includes three dashboards, each focused on a different part of the platform. You’ll find them in the left-hand navigation menu.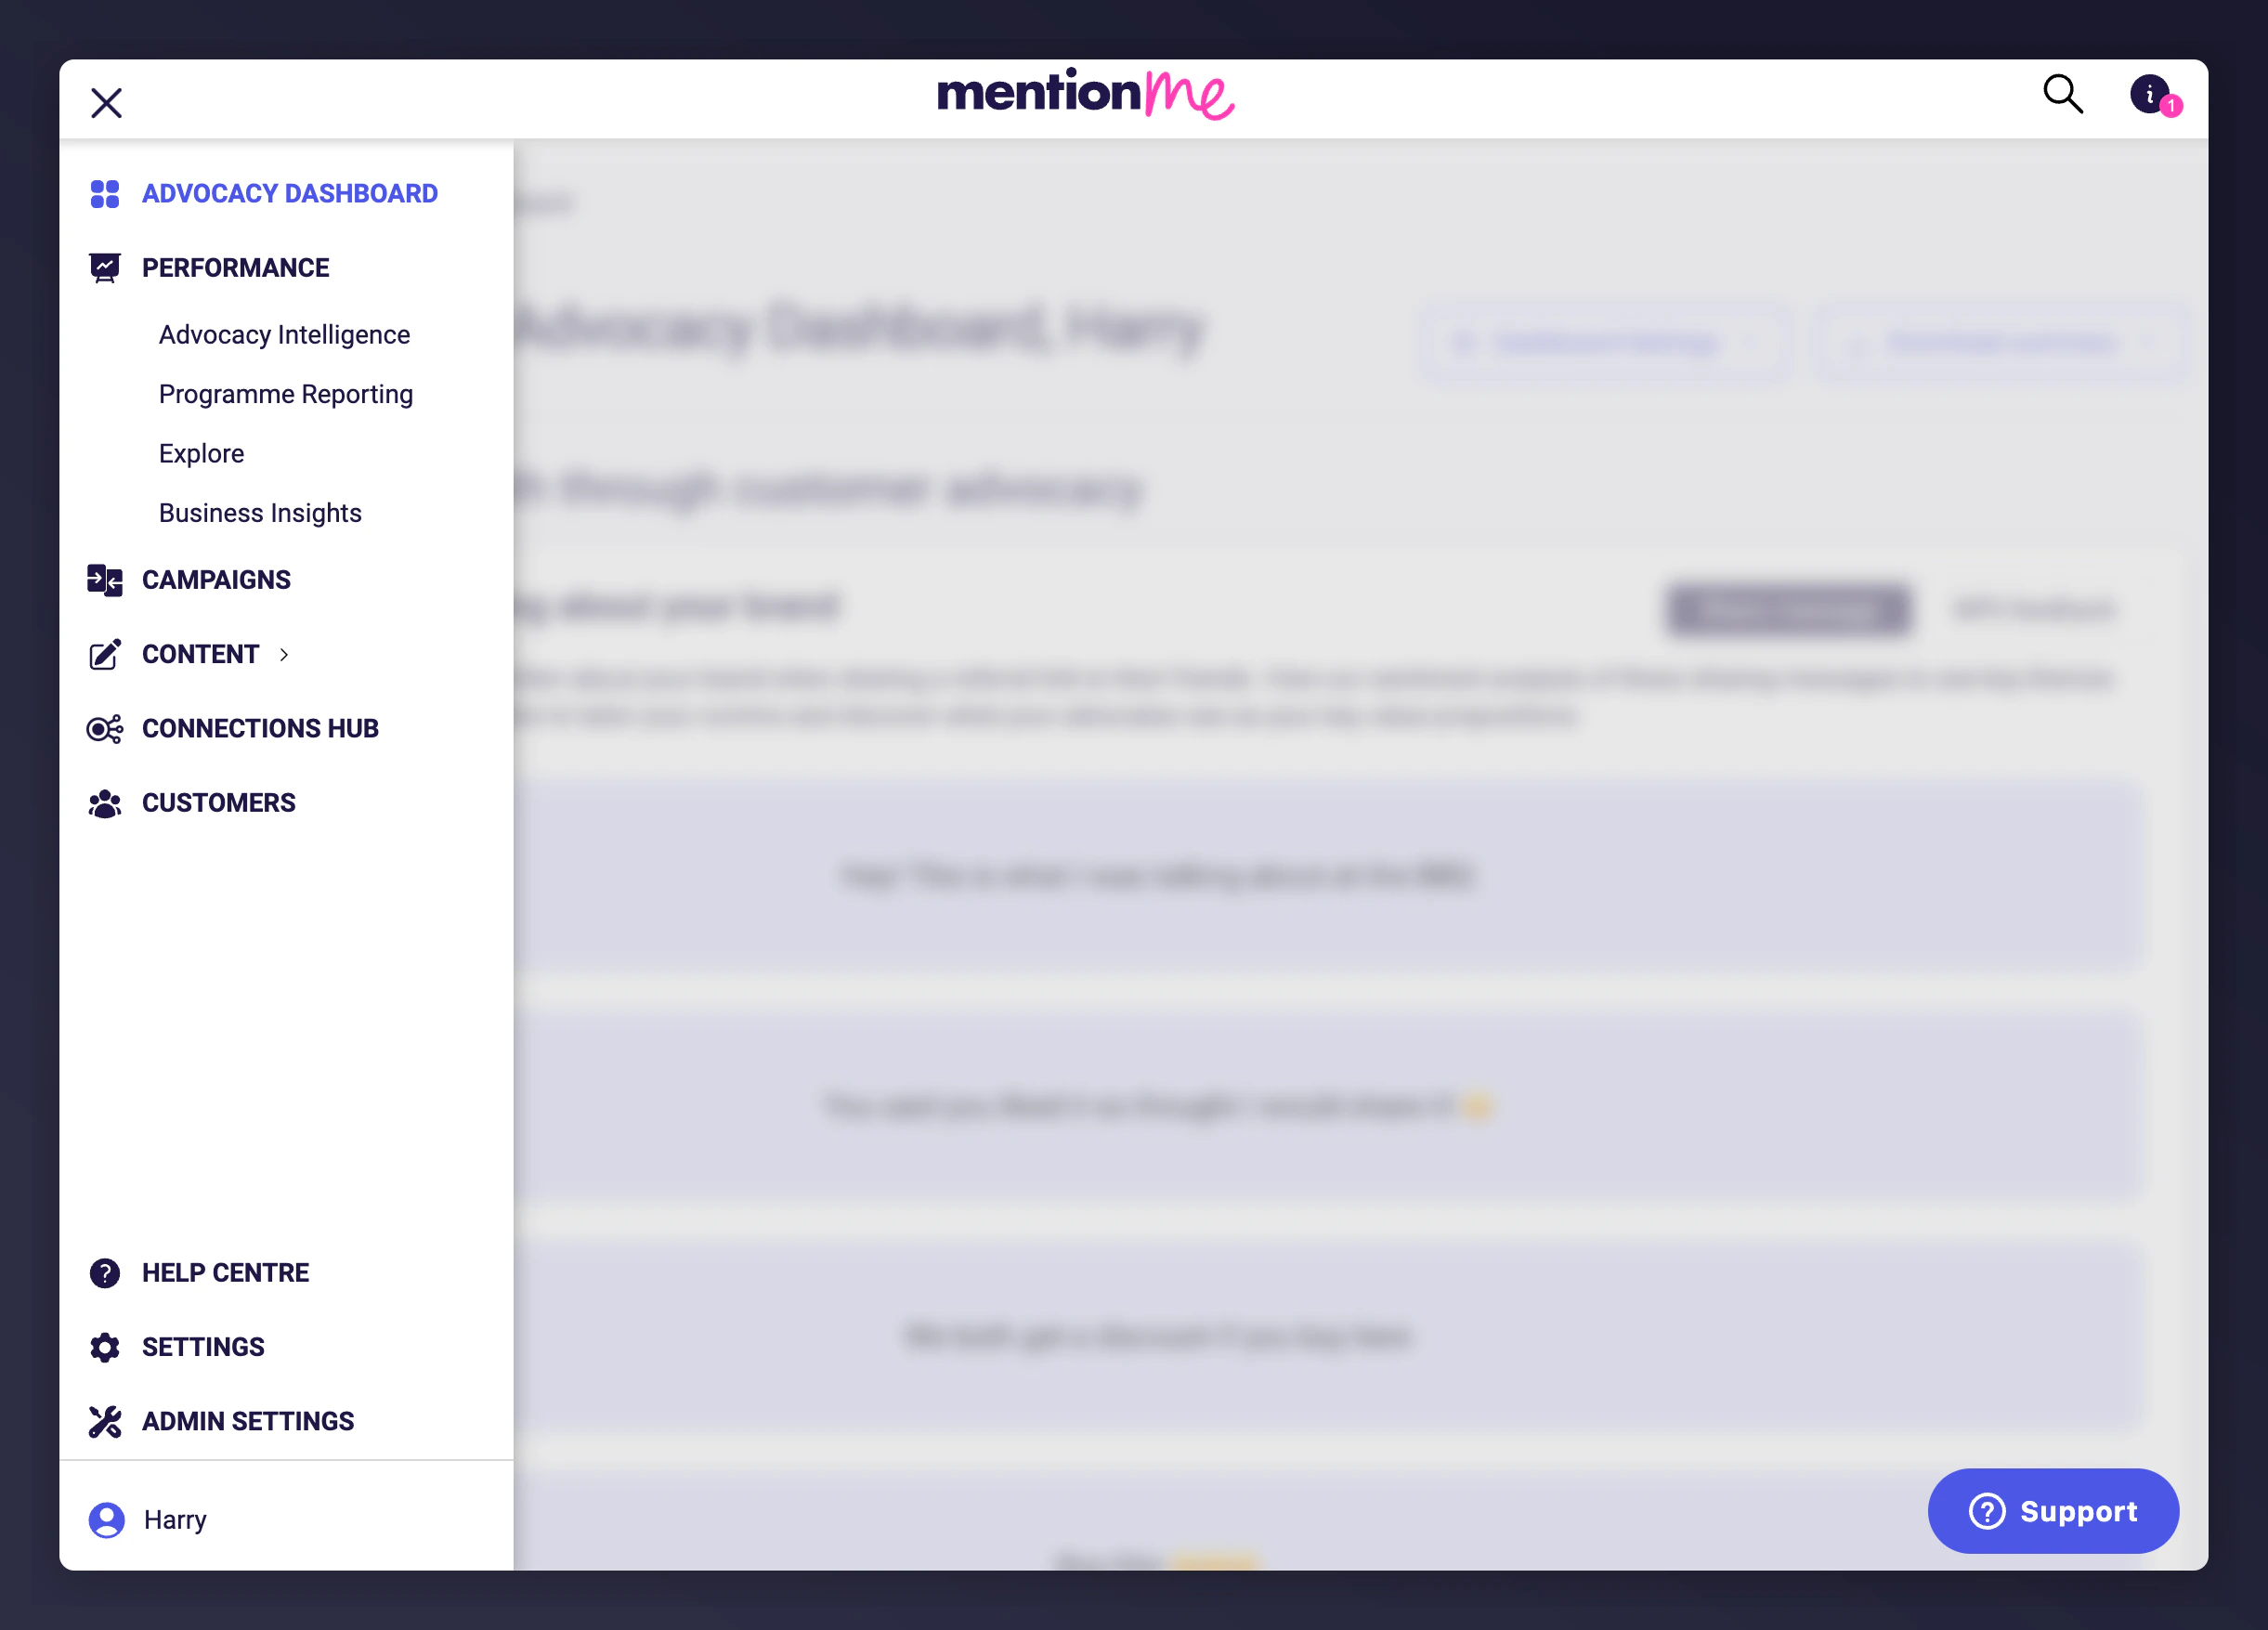
The left-hand navigation menu showing the three dashboard options.
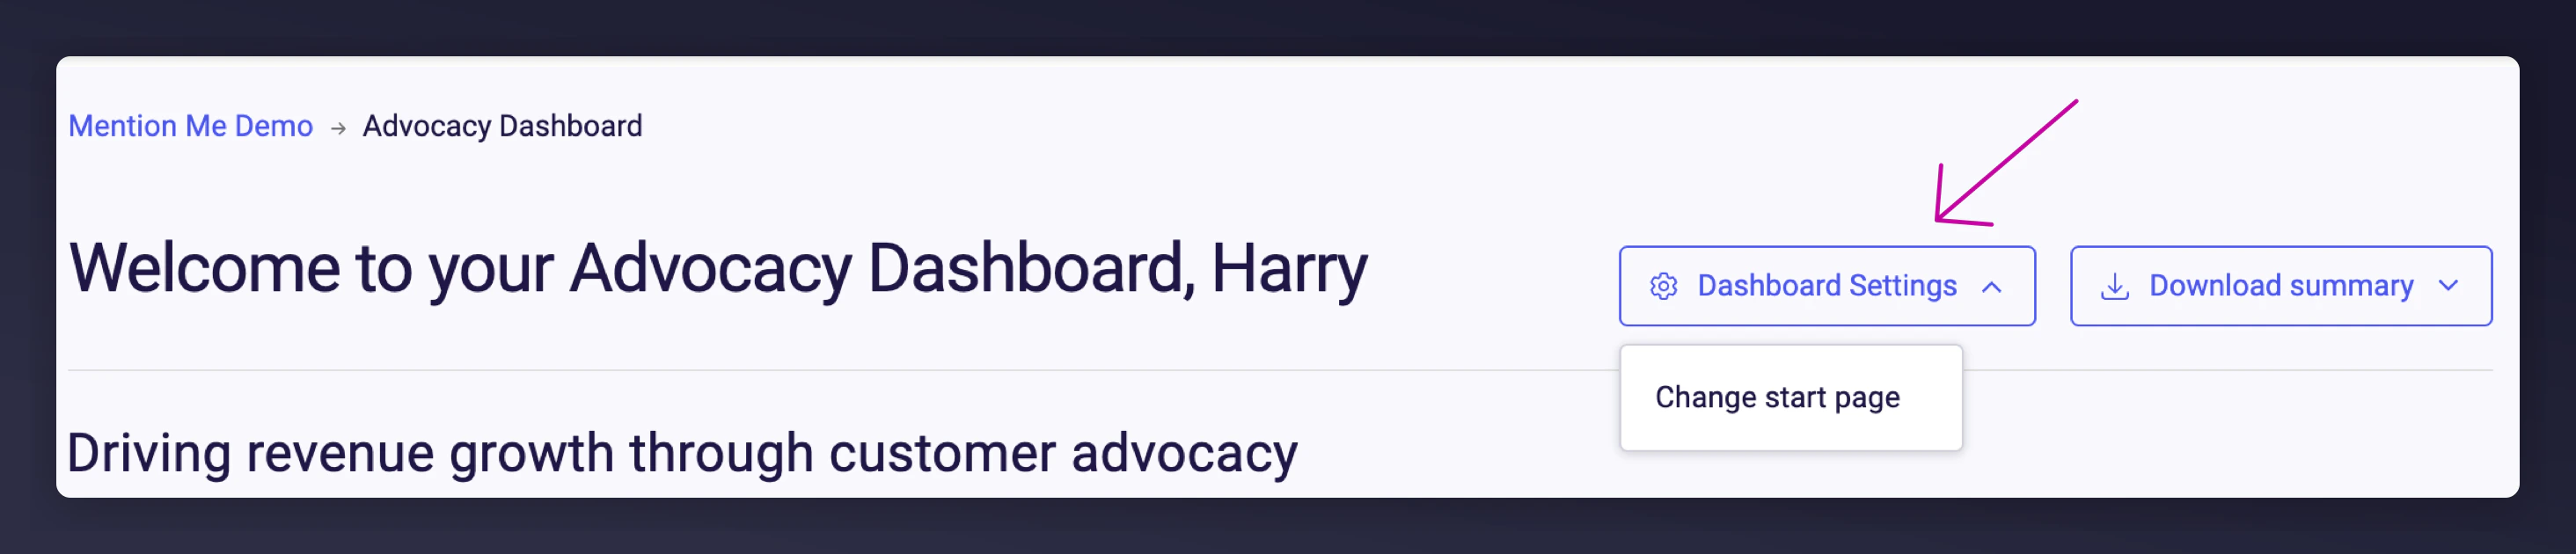
Programme Reporting in the navigation, alongside the Dashboard Settings option.
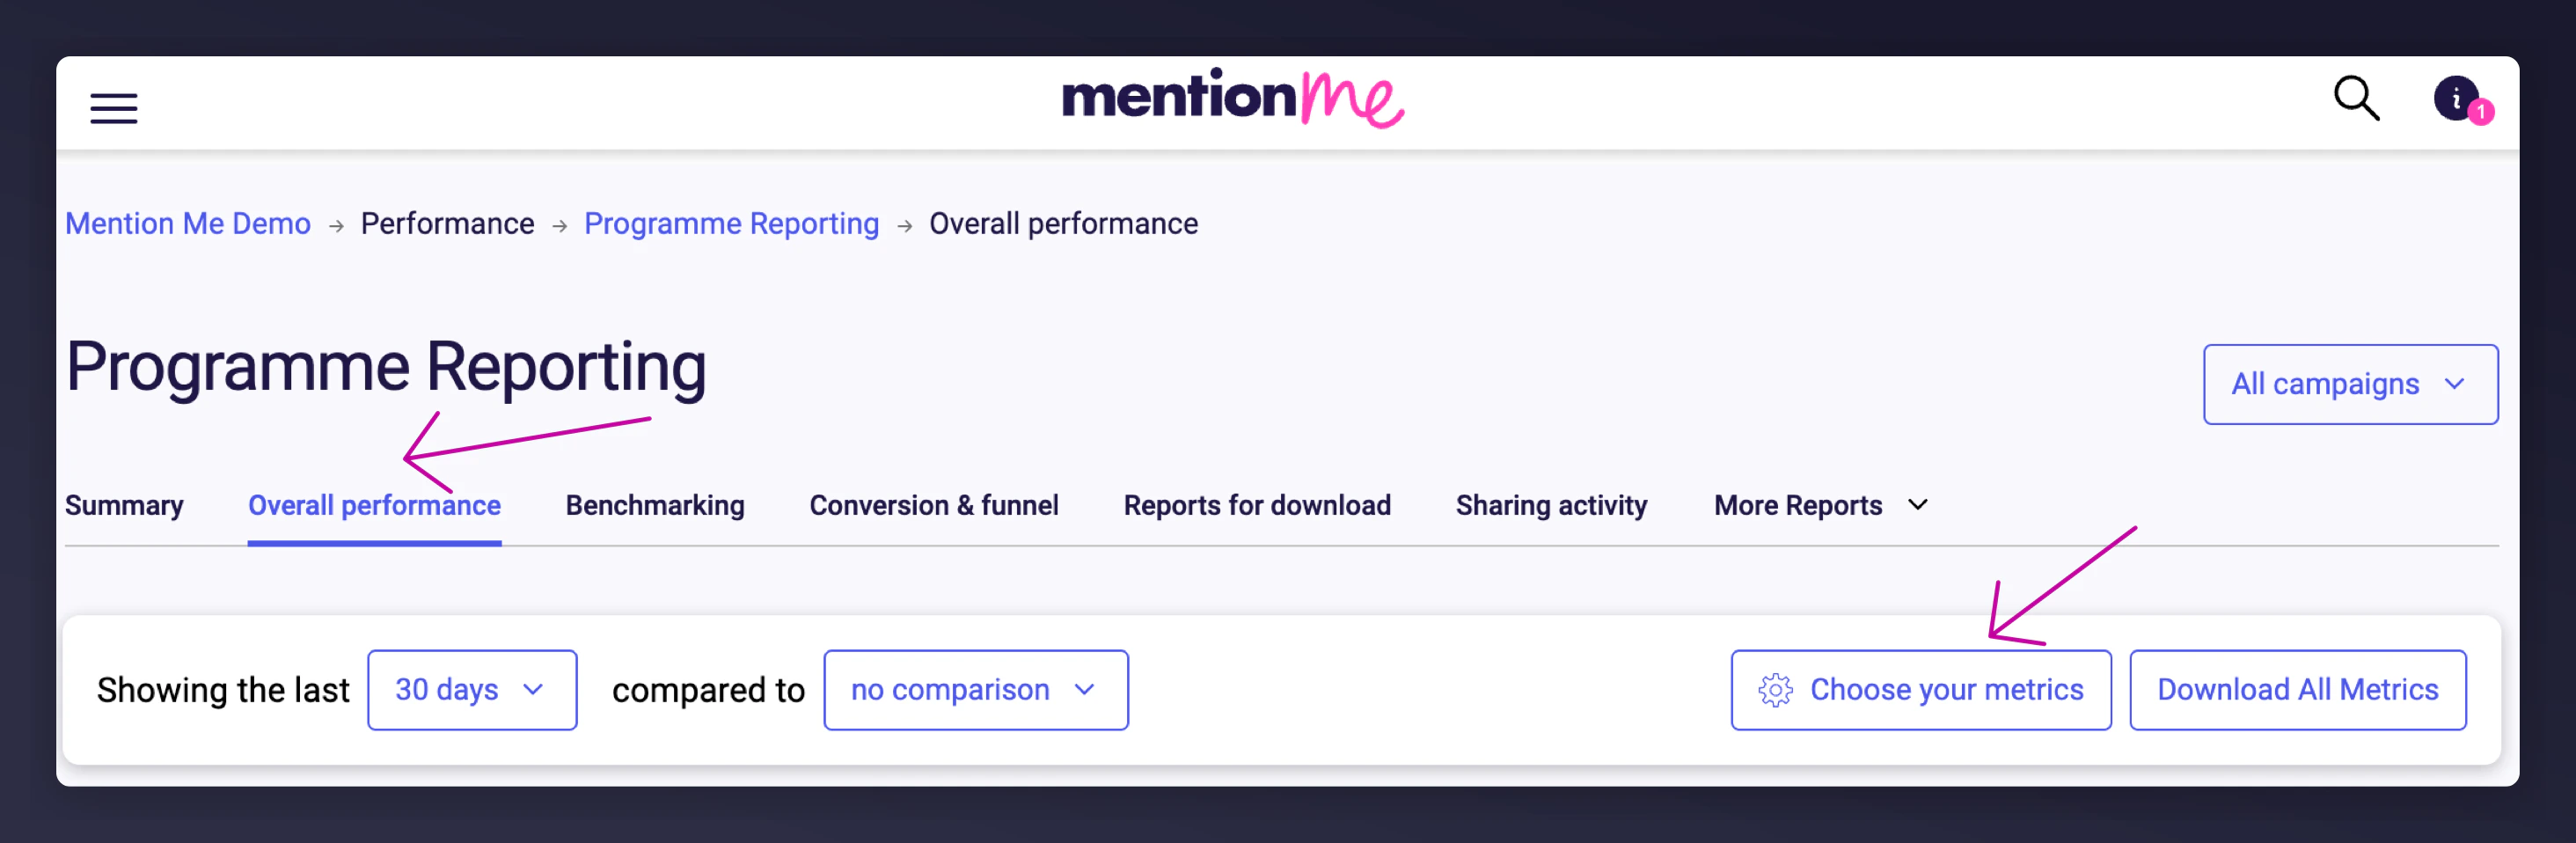
The Overall Performance tab with its customisable metric display.
Advocacy Dashboard
The Advocacy Dashboard gives headline information on the overall value of advocacy and Mention Me. It lets you quickly access deeper insights to share with decision makers.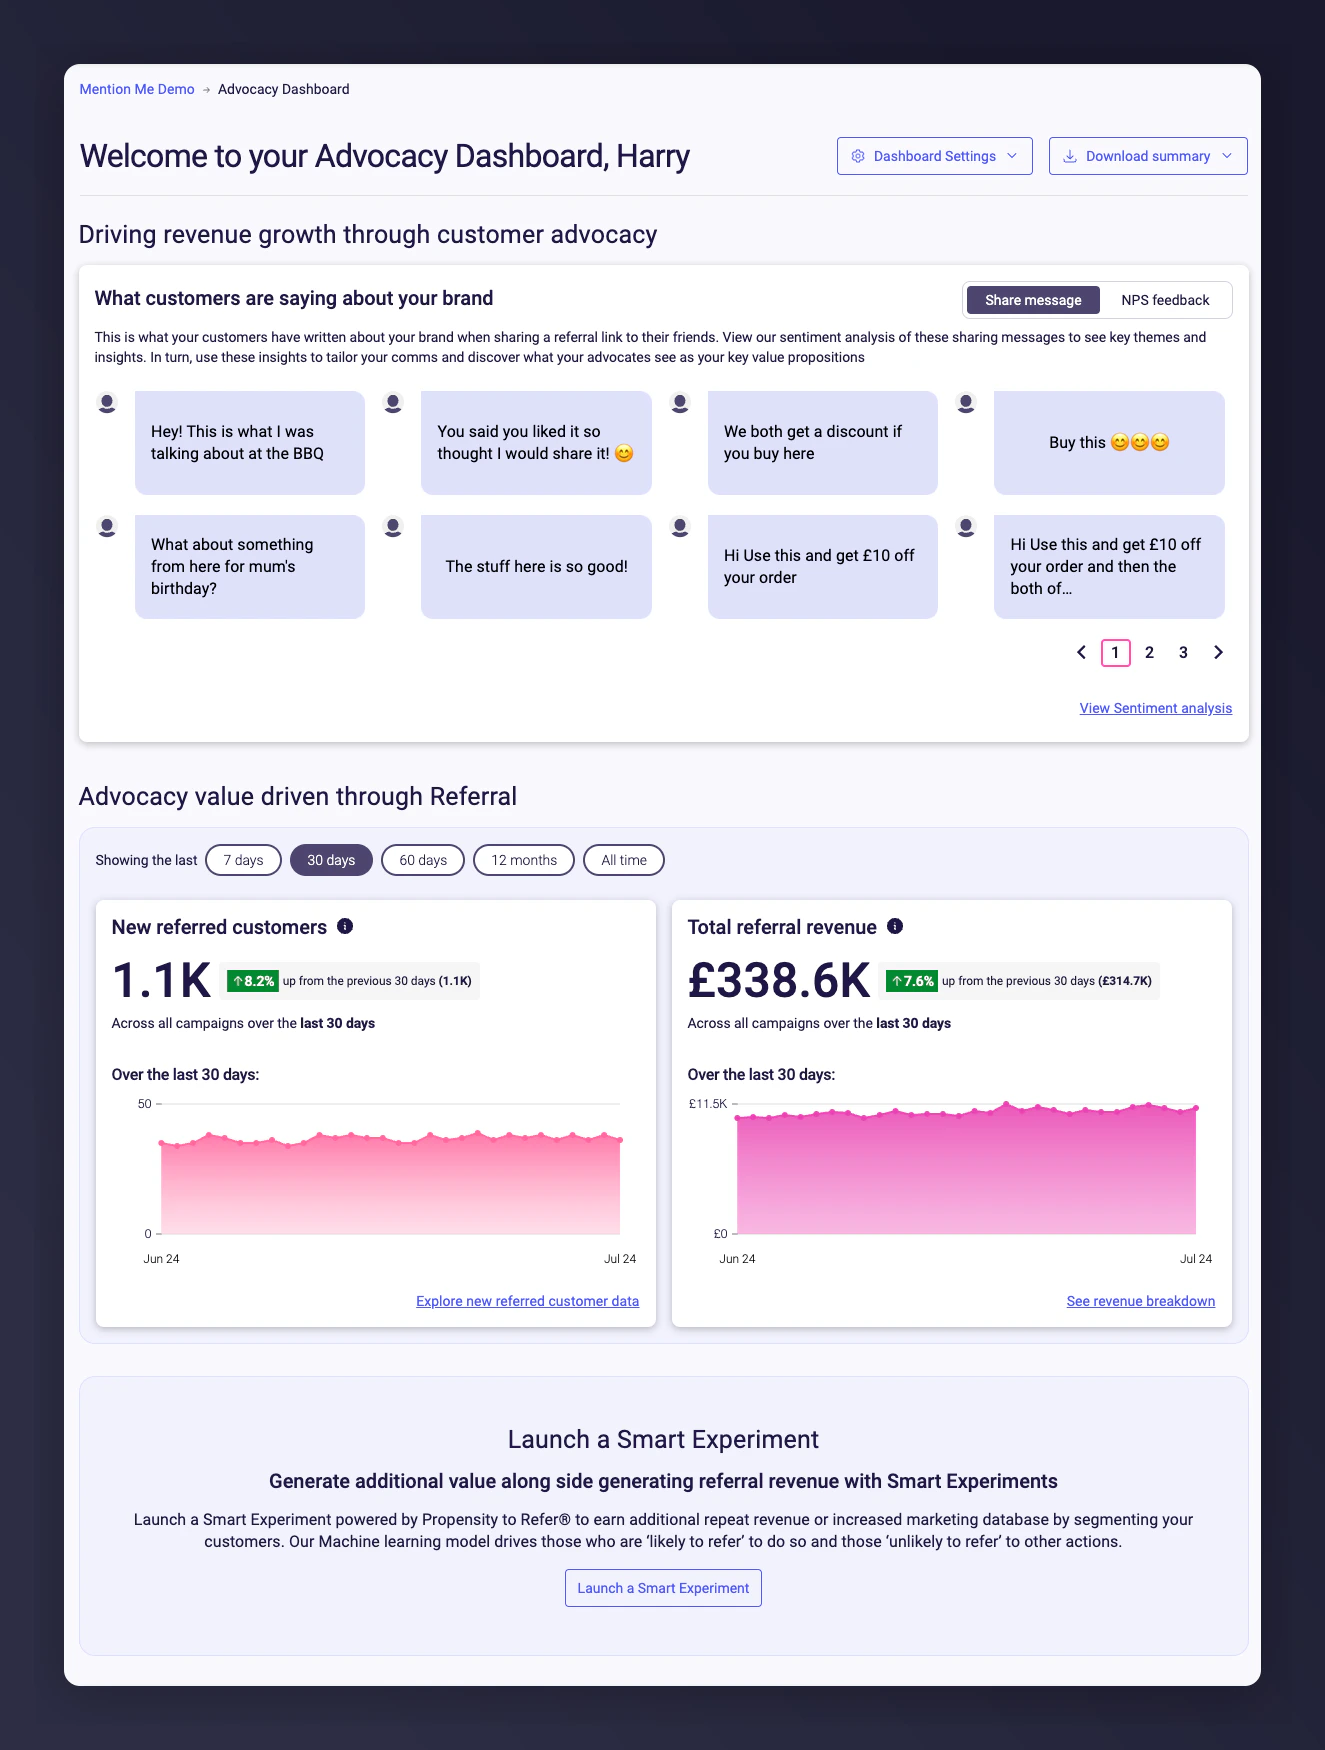
The Advocacy Dashboard with sentiment, Earned Growth, ECR, and referral metrics
- Recent customer sentiment: A quick view of how customers feel about your brand. Learn more about Sentiment Analysis.
- Earned Growth Score: Top-level advocacy progress and its financial impact. Learn more about Earned Growth.
- Average ECR: Month-to-month trends for the value of your advocates.
- Referral Metrics: How many new customers and how much revenue is generated by Mention Me.
- NPS Split: How much of your customer base has a positive or negative experience.
- Integrations Setup: Confirmation of which parts of your Martech stack are integrated with Mention Me.
- Contacts & Opt Ins: First-party contacts and marketing opt-ins being captured.
Advocacy Intelligence
This dashboard provides deeper detail on advocacy metrics and activities, bringing together Earned Growth, ECR, and Sentiment on one page.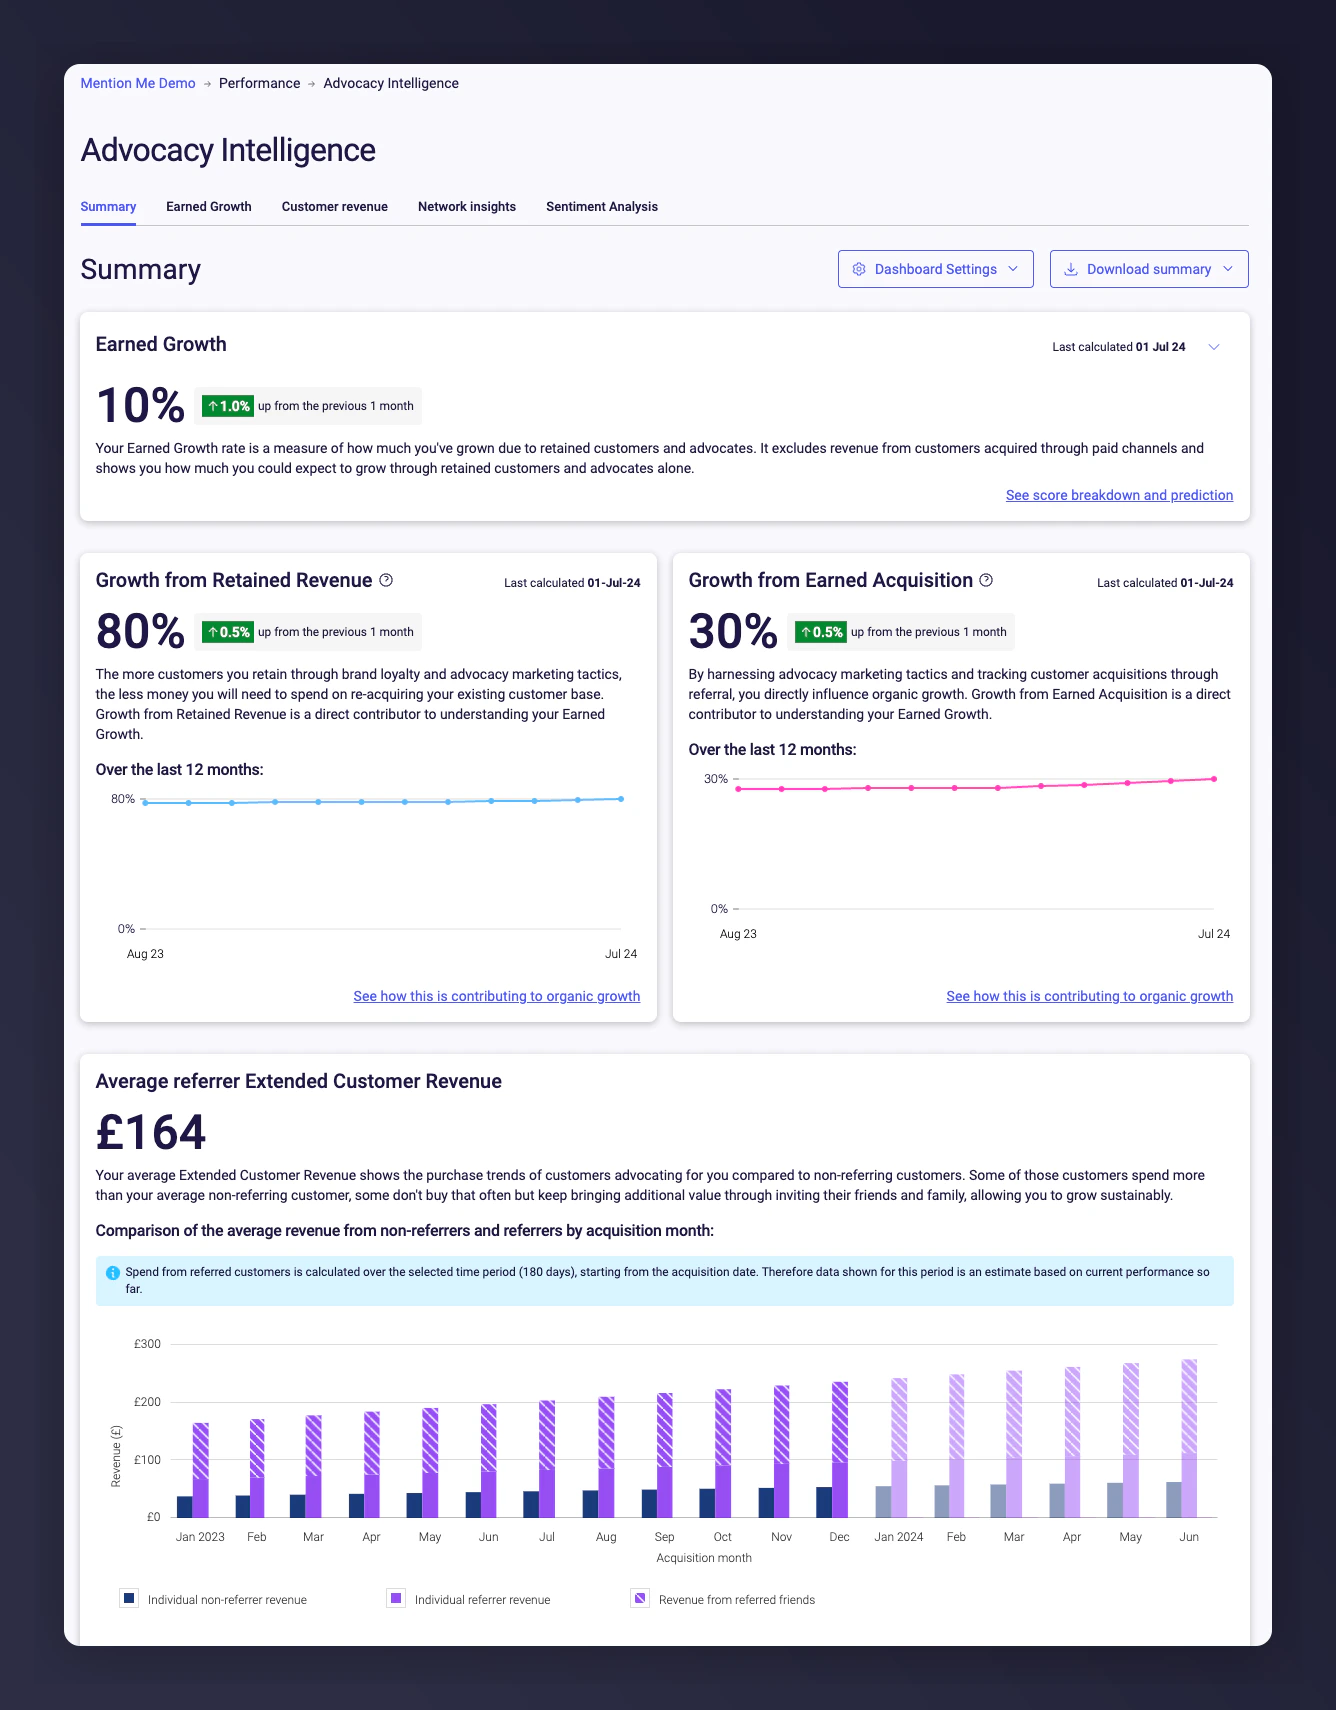
Advocacy Intelligence with Earned Growth breakdown, ECR segments, and Best Network
- Earned Growth Breakdown: The components that make up your Earned Growth score.
- ECR Segment Sizes: The size of each segment to target the most valuable customers.
- Predicted ECR segments (Optimise, Advanced, Ultimate only): Spot and act on trends in your customer segments.
- Best Network: How networks form and the compounding effect of advocacy.
Programme Reporting
The Programme Reporting dashboard is for campaign owners seeking deeper detail on referral campaign performance.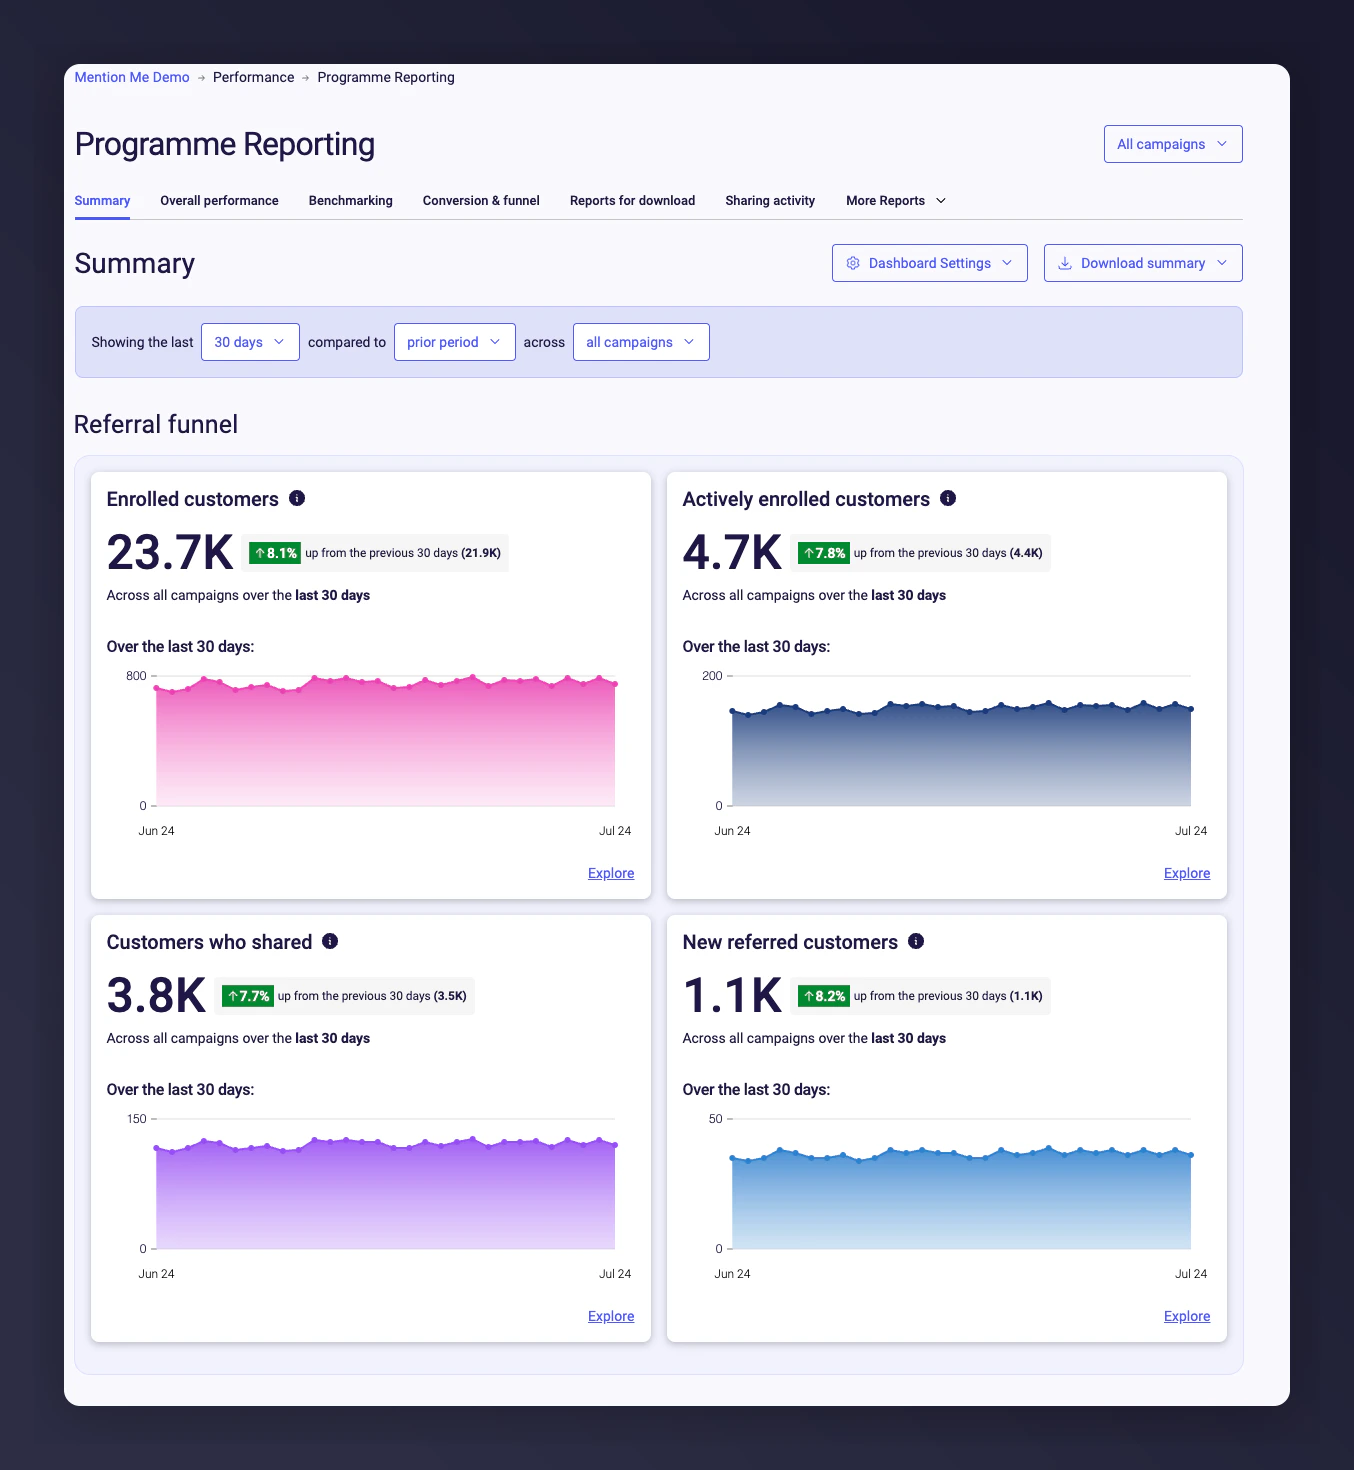
Programme Reporting with revenue breakdowns and key referral metrics
- Revenue Breakdowns: Where referral campaign revenue comes from - new customers, repeat purchases, and subsequent orders.
- Key Referral Metrics: New Customers, Share Rate, and Conversion to understand where you’re succeeding and where to focus.
- Campaign Comparisons: Quickly identify which campaigns may be underperforming.
Downloading Dashboards
You can save a screenshot or PDF of any dashboard to share offline, right from the top of the page.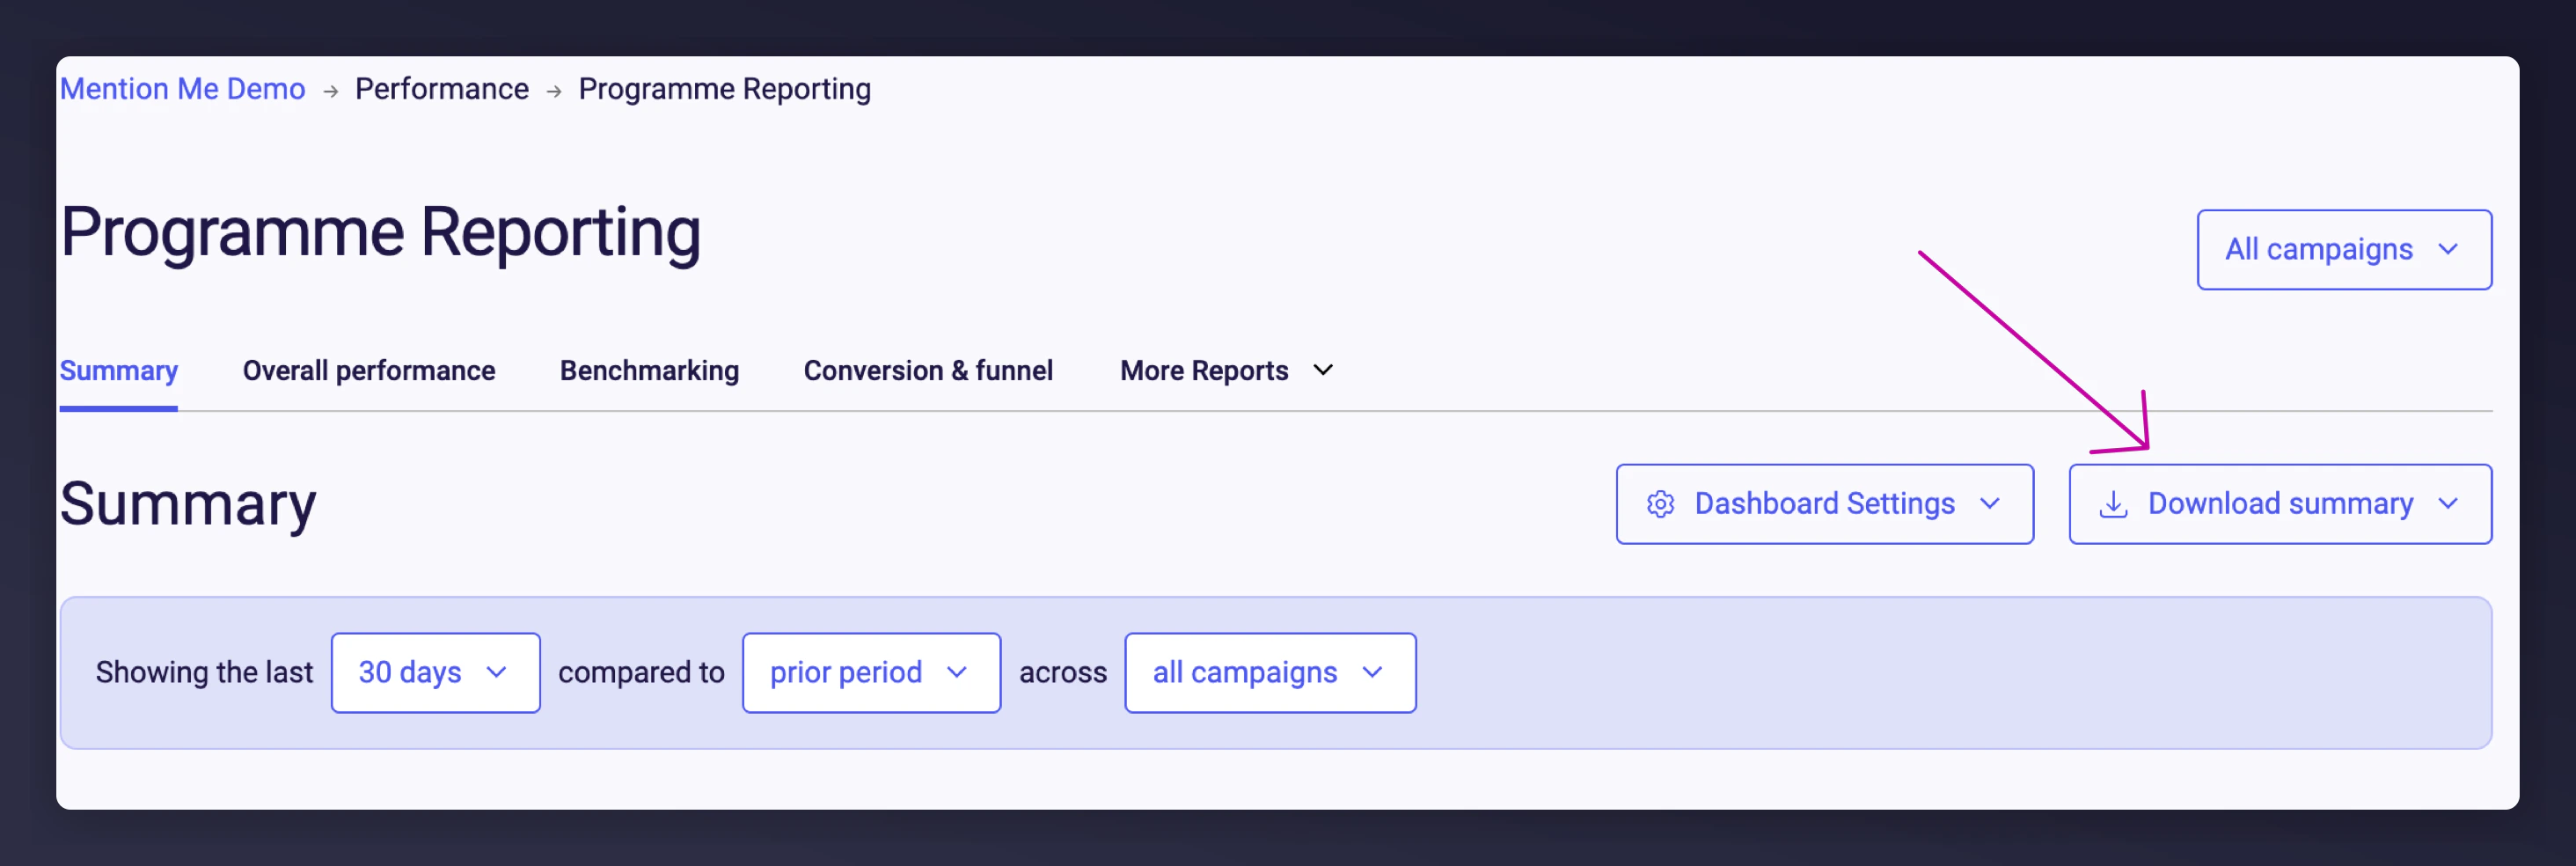
The download button at the top of the dashboard for saving screenshots or PDFs.