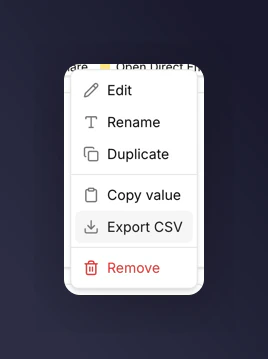
Export a tile to CSV
- Click the three-dot menu in the top corner of the tile.
- Click Export CSV.
What’s in the CSV
Depends on the tile type.Metric tile
A single row with the metric name, value, and the comparison value if one is set.Chart tile
One row per data point. Columns cover each metric plotted. If the chart has a breakdown, one row per combination of time bucket and breakdown value.Table tile
Exactly what you see on screen. One row per table row, one column per metric. If the table has a breakdown, the breakdown value is the first column.Markdown tile
Markdown tiles cannot be exported. There’s no data behind them, so the menu hides the Export CSV option.Copy a single value
For metric tiles specifically, there’s a shortcut that skips the CSV step:- Open the tile menu.
- Click Copy value.
Filters and comparisons carry over
The CSV reflects the tile as you see it:- The dashboard’s time period and market filter are applied.
- If the tile has a comparison, the comparison values are included as extra columns.
- If the tile has a breakdown, each breakdown value appears as its own row or group of rows.
What you cannot export
There is no “export the whole dashboard” action. Export each tile separately.Next
- Report to stakeholders for patterns around packaging these exports.
- Breakdowns to shape what ends up in the CSV before you export.