Use markdown tiles as section headers
Dashboards read better when they’re structured into sections. Markdown tiles labelled## Revenue, ## Funnel, ## Campaigns give the dashboard a table of contents that reads top-to-bottom.
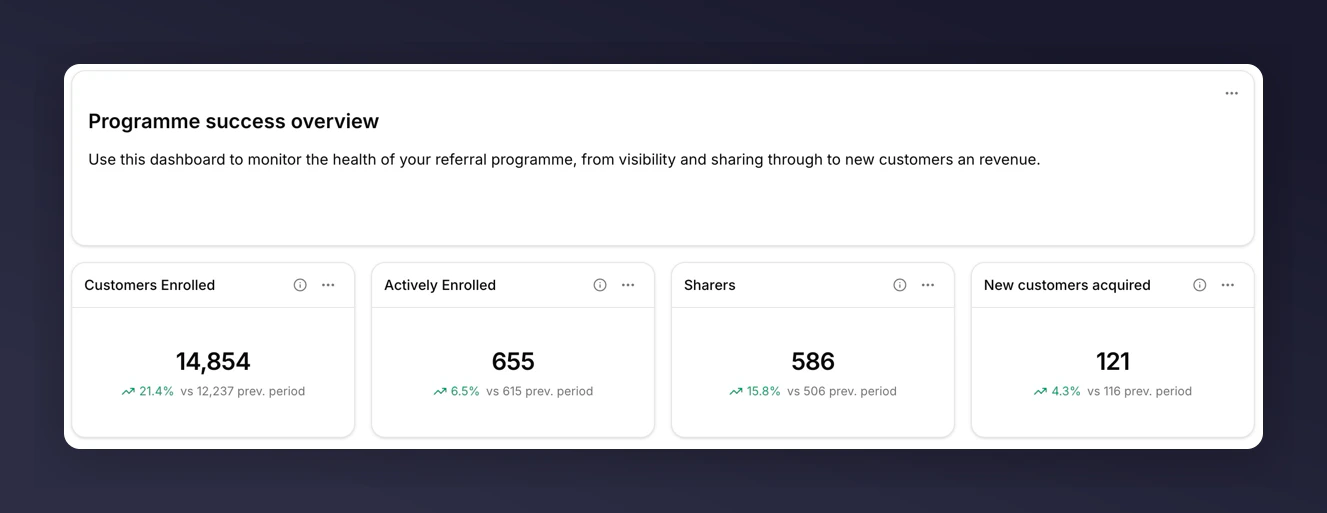
## for section headings, ### for subsections. The markdown tile spans the full grid width by default.
You can also use markdown tiles for commentary: a sentence or two explaining what a screenshot of the dashboard can’t, like “Campaign X paused mid-April, so numbers are expected to be low.”
Copy individual values for email or chat
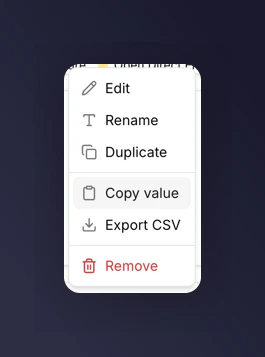
For pasting a single headline number into Slack, email, or a document:- Click the tile menu (three dots in the corner of a metric tile).
- Click Copy value.
Export raw data for a spreadsheet
For anyone who wants to slice the numbers themselves, export CSV per tile. See export data for what’s included per tile type.Screenshots for decks
The dashboard grid is designed to screenshot well at 12 columns wide. A few things help:- Set the filter bar to the period you want to present before capturing, so it’s visible in the screenshot.
- Close or narrow the sidebar to give the dashboard the full width.
- For individual tiles, use the tile menu’s Full screen action and screenshot that, so the tile fills the frame.
Deck-ready pattern
- One dashboard per stakeholder question (don’t try to serve every audience at once).
- Markdown section headers that match the structure of your narrative.
- Export CSV for anyone who wants raw data.
- Screenshot the headline tiles.
- Link to the dashboard at the end of the deck for anyone who wants to explore.
Next
- Export data.
- Monitor revenue quality for a stakeholder-ready view out of the box.