Prerequisite
Your brand must be in a benchmarked category. If it is, the Industry benchmark option appears in the Compare picker for eligible metrics. If it is not, the option is hidden.Fastest path: Industry Benchmarking template
The Industry Benchmarking template is purpose-built. It’s 19 tiles covering the full funnel, all pre-configured with the Industry benchmark comparison.- New dashboard → Browse templates → Industry Benchmarking Dashboard.
- The dashboard opens populated.
Build it yourself
If you want benchmark comparisons on a single metric, add one to a dashboard you already have.- Edit an existing tile, or Add tile with an eligible metric (see the list below).
- In Compare to, pick Industry benchmark.
- Save.
The eight eligible metrics
Only these metrics can use the industry benchmark comparison:- Enrolment Rate
- Share Rate
- Purchase Rate
- Impressions per Order
- Shares per Sharer
- Responses per Share
- Incented Friends per Share Response
- Purchases per Incented Friend
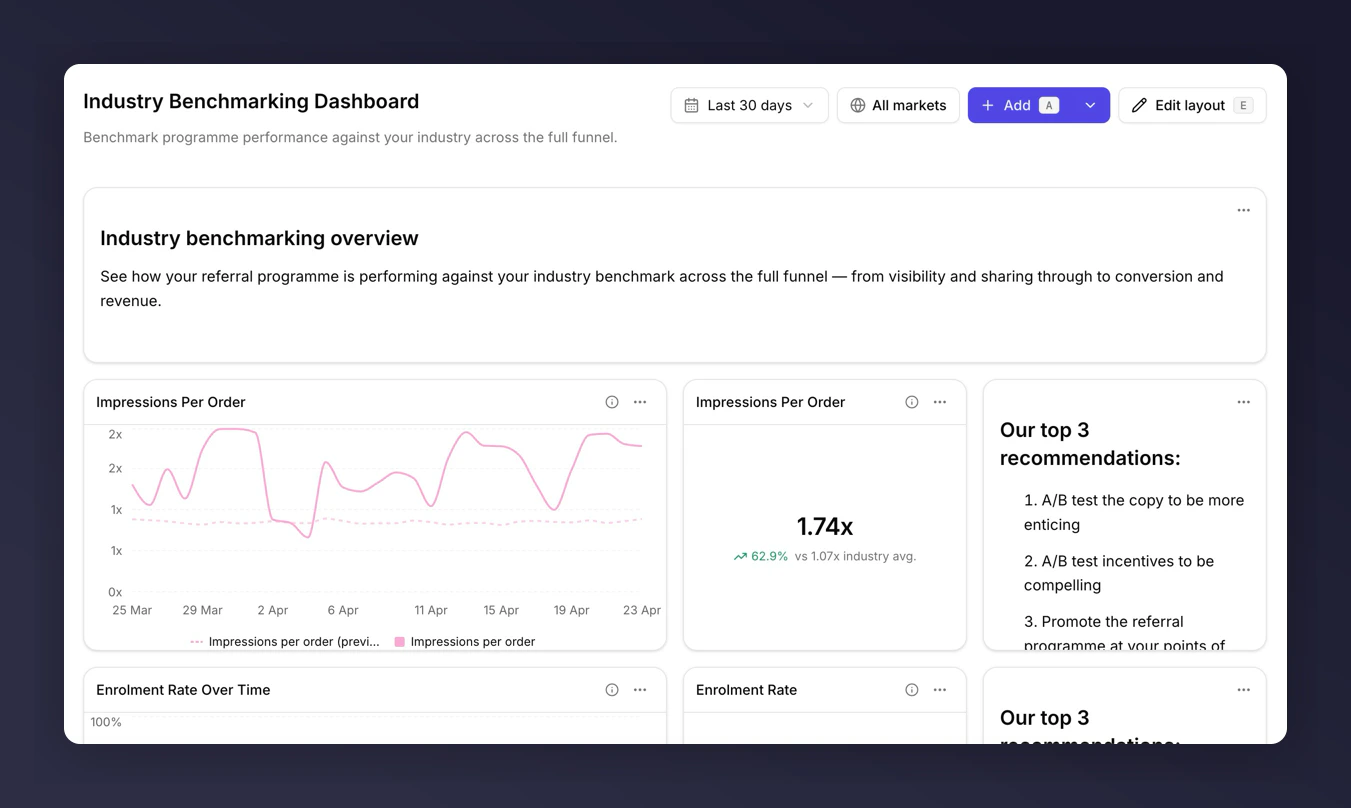
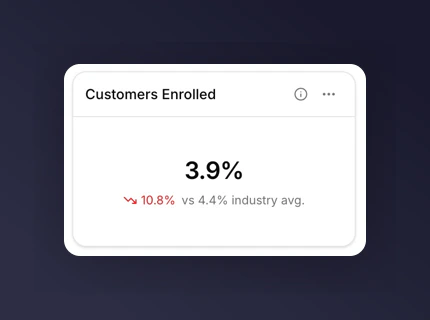
Reading the comparison
On a metric tile, the benchmark sits below the main number labelled “industry avg.”. A green delta means you’re above the benchmark; red means below. On a line chart, the benchmark renders as a dashed line for the same period.What to do with it
- Above benchmark at Share Rate but below on Purchase Rate. Your sharing is landing; your incentive or purchase journey isn’t. A Share Rate two points above industry usually means your referral copy is working. Focus the fix on the post-share funnel.
- Below benchmark on Enrolment Rate. Placement or offer clarity is the first fix.
- Below benchmark across the board. The programme shape or incentive structure is worth a review with your Mention Me contact.
Next
- Comparisons for how the benchmark comparison renders across tile types.
- Metrics glossary for which metrics are benchmark-eligible and why.