Fastest path: Revenue & Customer Quality template
The Revenue & Customer Quality template assembles this view. Nine tiles, mostly metric cards. New dashboard → Browse templates → Revenue & Customer Quality.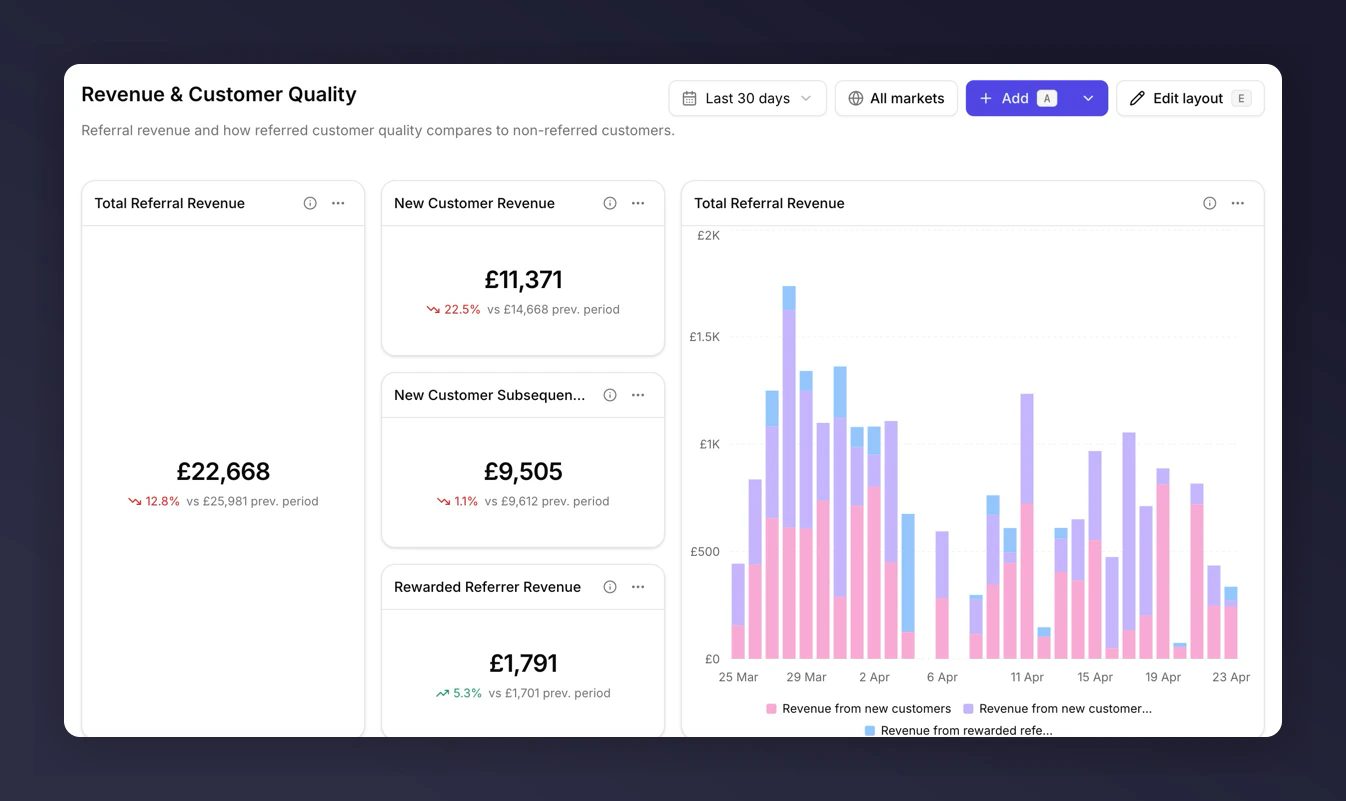
Build it yourself
1. First-order value: referred vs non-referred
Two metric tiles side by side:- New Customer AOV
- Non-Referred Customer AOV
2. Repeat-purchase value
One line chart:- New Customer Subsequent Revenue over time (last 12 months).
3. Headline revenue
One metric tile:- Total Referral Revenue with Compare to previous period.
The usual story
Across most referral programmes, referred customers:- Have a higher AOV on first orders than non-referred customers.
- Repeat purchase at a higher rate.
- Therefore contribute more subsequent revenue per head over time.
Next
- Metrics glossary for what each revenue metric covers.
- Report to stakeholders to turn this dashboard into a deck or email.