Where breakdowns apply
Breakdowns work on chart and table tiles.- Metric tiles. Do not support breakdowns. Use a chart or table instead.
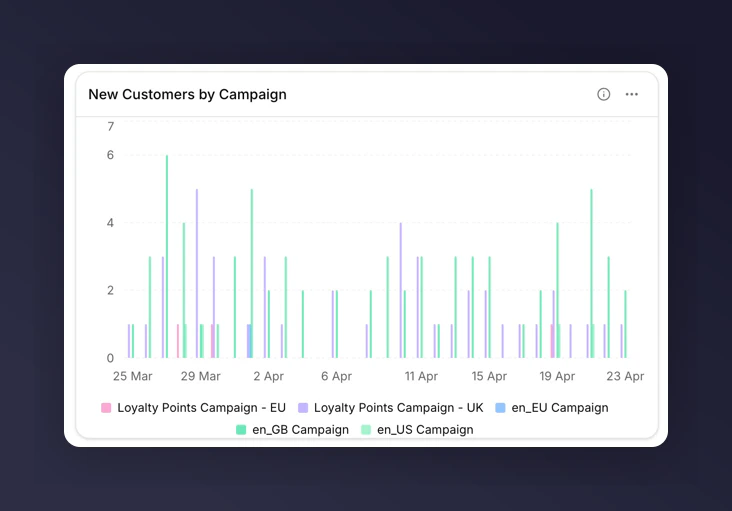
- Line and bar charts. Breakdown is optional. Adding one renders multiple series (one per value).
- Stacked bar. Breakdown is optional. Pair with a breakdown to stack its values; without one, multiple metrics stack instead.
- Share. Breakdown is optional. Segments come from breakdown values, or from multiple metrics if no breakdown is set.
- Funnel. Breakdown is not supported.
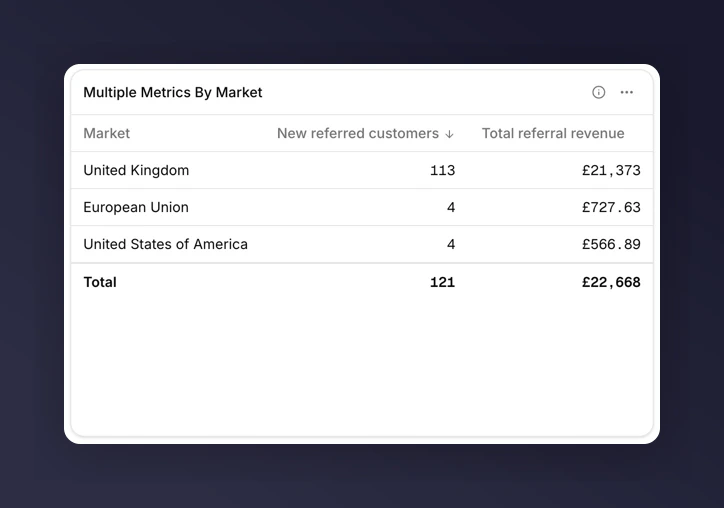
- Table. Breakdown is optional. Each row of the table becomes a value of the breakdown.
Add a breakdown
- Edit the chart or table tile.
- In the tile editor, find the Breakdown field.
- Pick a breakdown from the list.
- Save.
Top-N and “Other”
Charts and tables show the top values by volume. Everything else collapses into an “Other” segment so the tile stays readable when a breakdown has many values (e.g. many campaigns or markets). To inspect the long tail, export the tile to CSV and look at the raw rows there.The mutual-exclusion rule
You can have a breakdown or a comparison on a tile, but not both.- Add a breakdown to a tile that already has “Compare to last year” set, and the comparison clears.
- Add a comparison to a tile that already has a breakdown, and the breakdown clears.
Next
- Breakdowns glossary for all nine dimensions.
- Chart types for which charts require or forbid a breakdown.
- Track campaign performance for a worked example.