What a dashboard contains
A dashboard holds tiles on a grid. Tiles are metric numbers, charts, tables, or markdown notes. You arrange them how you like. See tile types. Every dashboard has its own time period and market filters at the top. Those apply to every tile on the dashboard. See filters and time periods.Scope
Dashboards exist at the brand level, not per user. Everyone on your team with Reporting access sees every dashboard that has been created. Dashboards are a shared workspace, not a private notebook.Data freshness
Reporting data refreshes once a day, overnight. Numbers you see today reflect activity up to the end of yesterday. A dashboard built in the morning will not show today’s activity until tomorrow.Anatomy
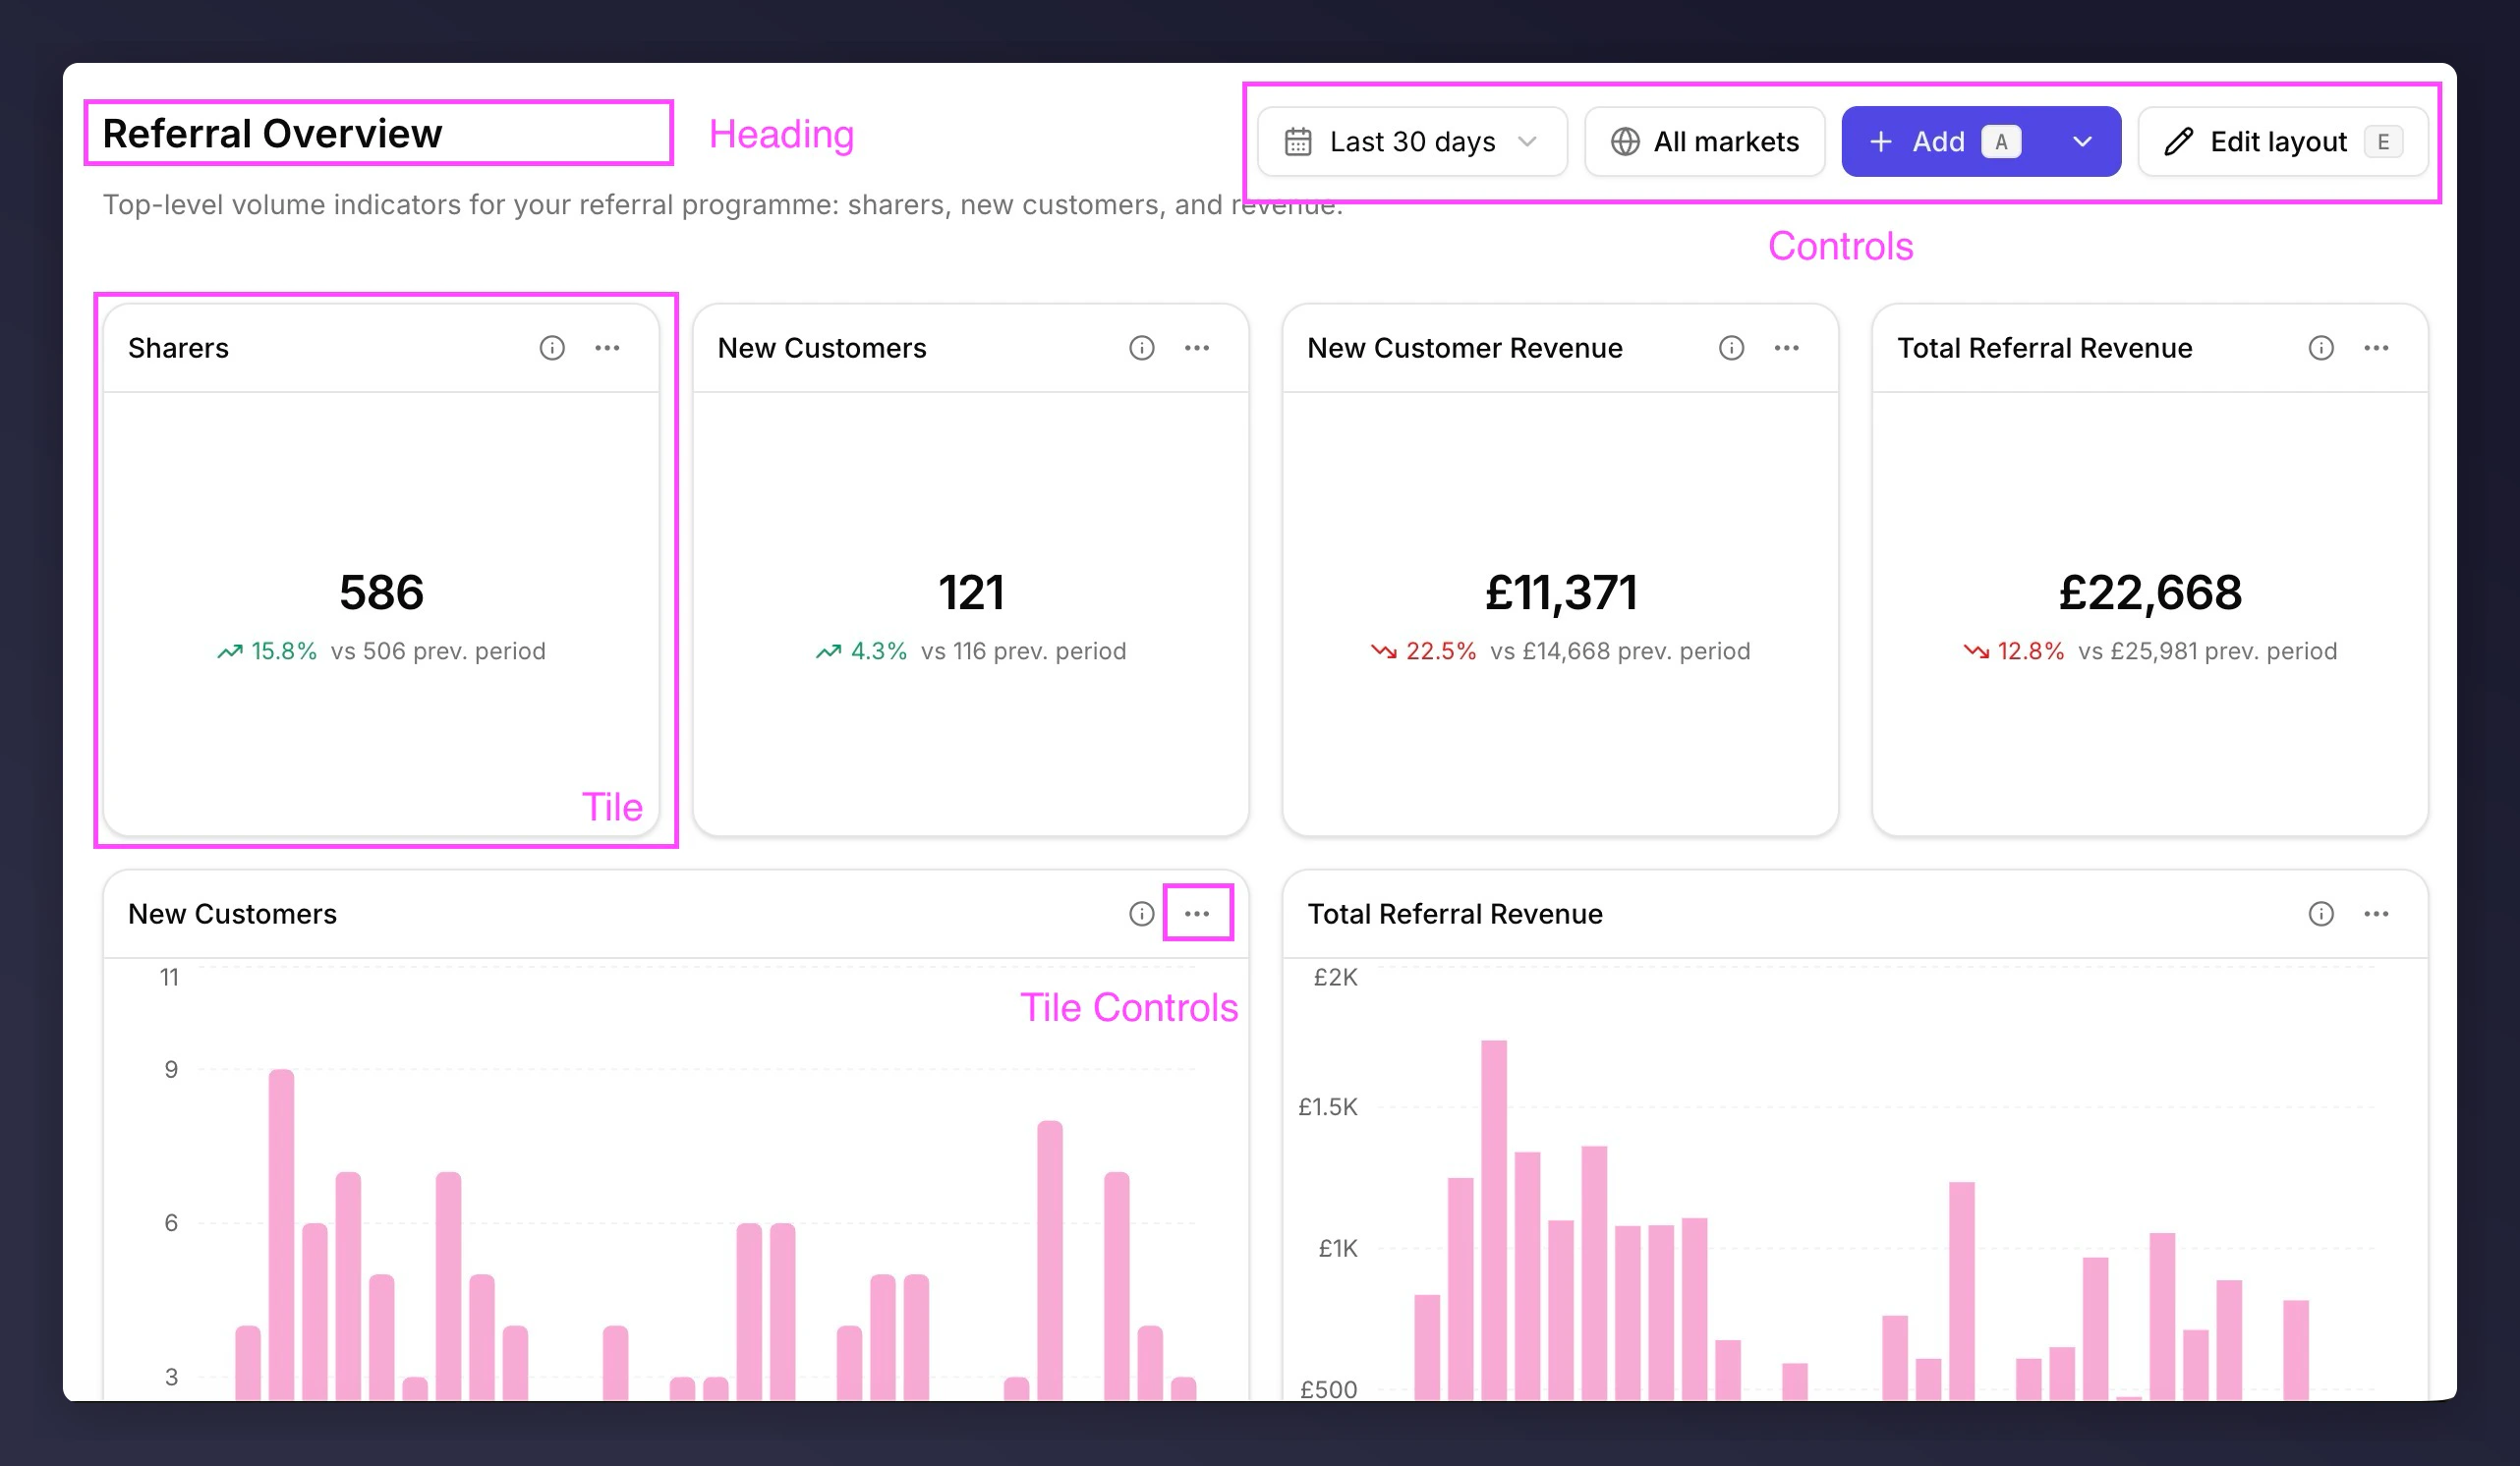
- Heading. Tells anyone landing on the dashboard what question it’s answering. Title, description, and breadcrumb back to the dashboards list.
- Controls. Sets the scope. Time period and market filter apply to every tile;
AddandEdit layoutchange the dashboard itself. - Tile. The unit of evidence. A metric, chart, table, or markdown note, sitting on a grid of up to 12 columns on desktop, 6 on tablet, and 1 on mobile.
- Tile controls. Per-tile actions. The info icon reveals the metric’s technical description; the menu has full screen, edit, rename, duplicate, copy value, export, and remove. Some actions only apply to certain tile types: full screen on charts and tables, copy value on metrics.