

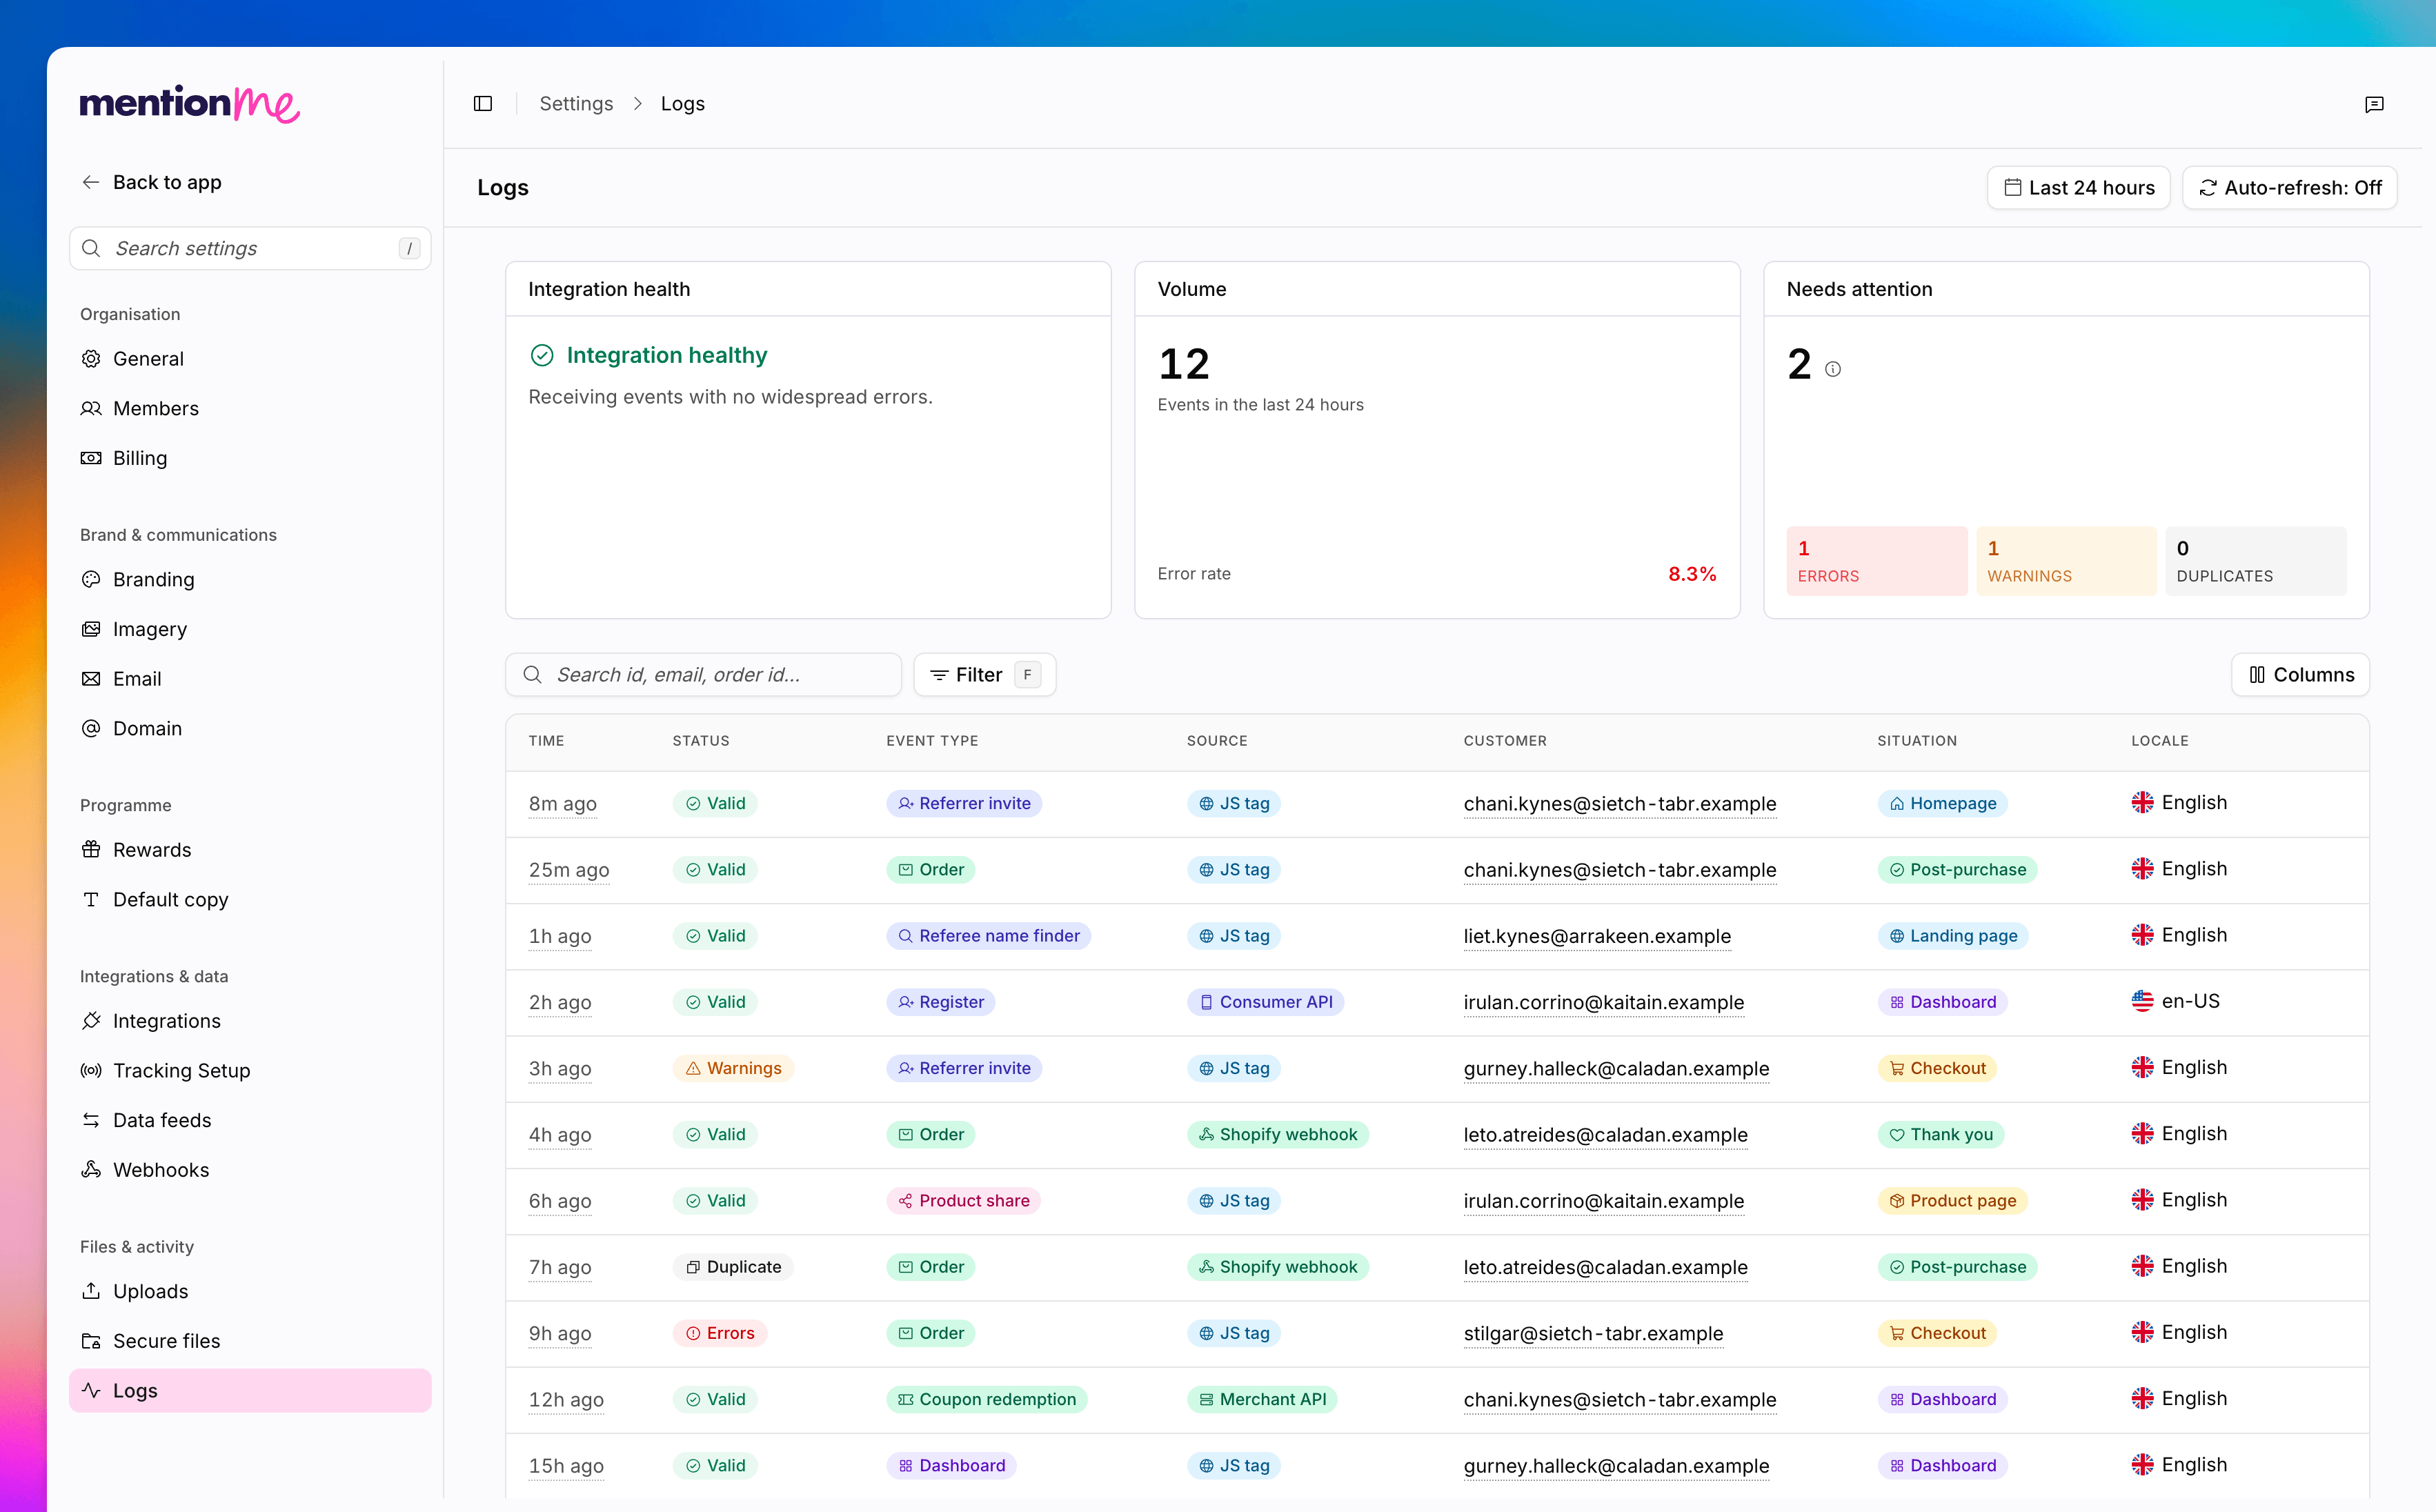
The Logs page, with summary cards, filters, and the event table.
Read the Summary Cards
Filter and Search
The header has a time range (Last hour, Last 24 hours, Last 7 days, Last 30 days) and an auto-refresh toggle. The default window is the last 24 hours. Filters include status, event type, source, situation, locale, currency, and app / version. Status values are Valid, Errors, Warnings, and Duplicates. Search accepts an id, email, or order id. The placeholder is Search id, email, order id… Click a row to open the event detail, including the payload and validation messages.See Also
How to Manage Tracking Setup
Choose an install method and find tag snippets.
Debug Dashboard
Classic documentation for the same kind of signal log.