> ## Documentation Index
> Fetch the complete documentation index at: https://docs.mention-me.com/llms.txt
> Use this file to discover all available pages before exploring further.
# Understanding the Overall Performance Report
> Understand what each metric in the Overall Performance report measures, how the referral funnel connects end to end, and what typical benchmarks look like.
Programme Reporting includes a summary page showing all of your key metrics at a glance. However, the metrics on that summary page aren't easy to edit or customise, so most people go straight to the **Overall Performance** page instead, which offers more control over what you see.
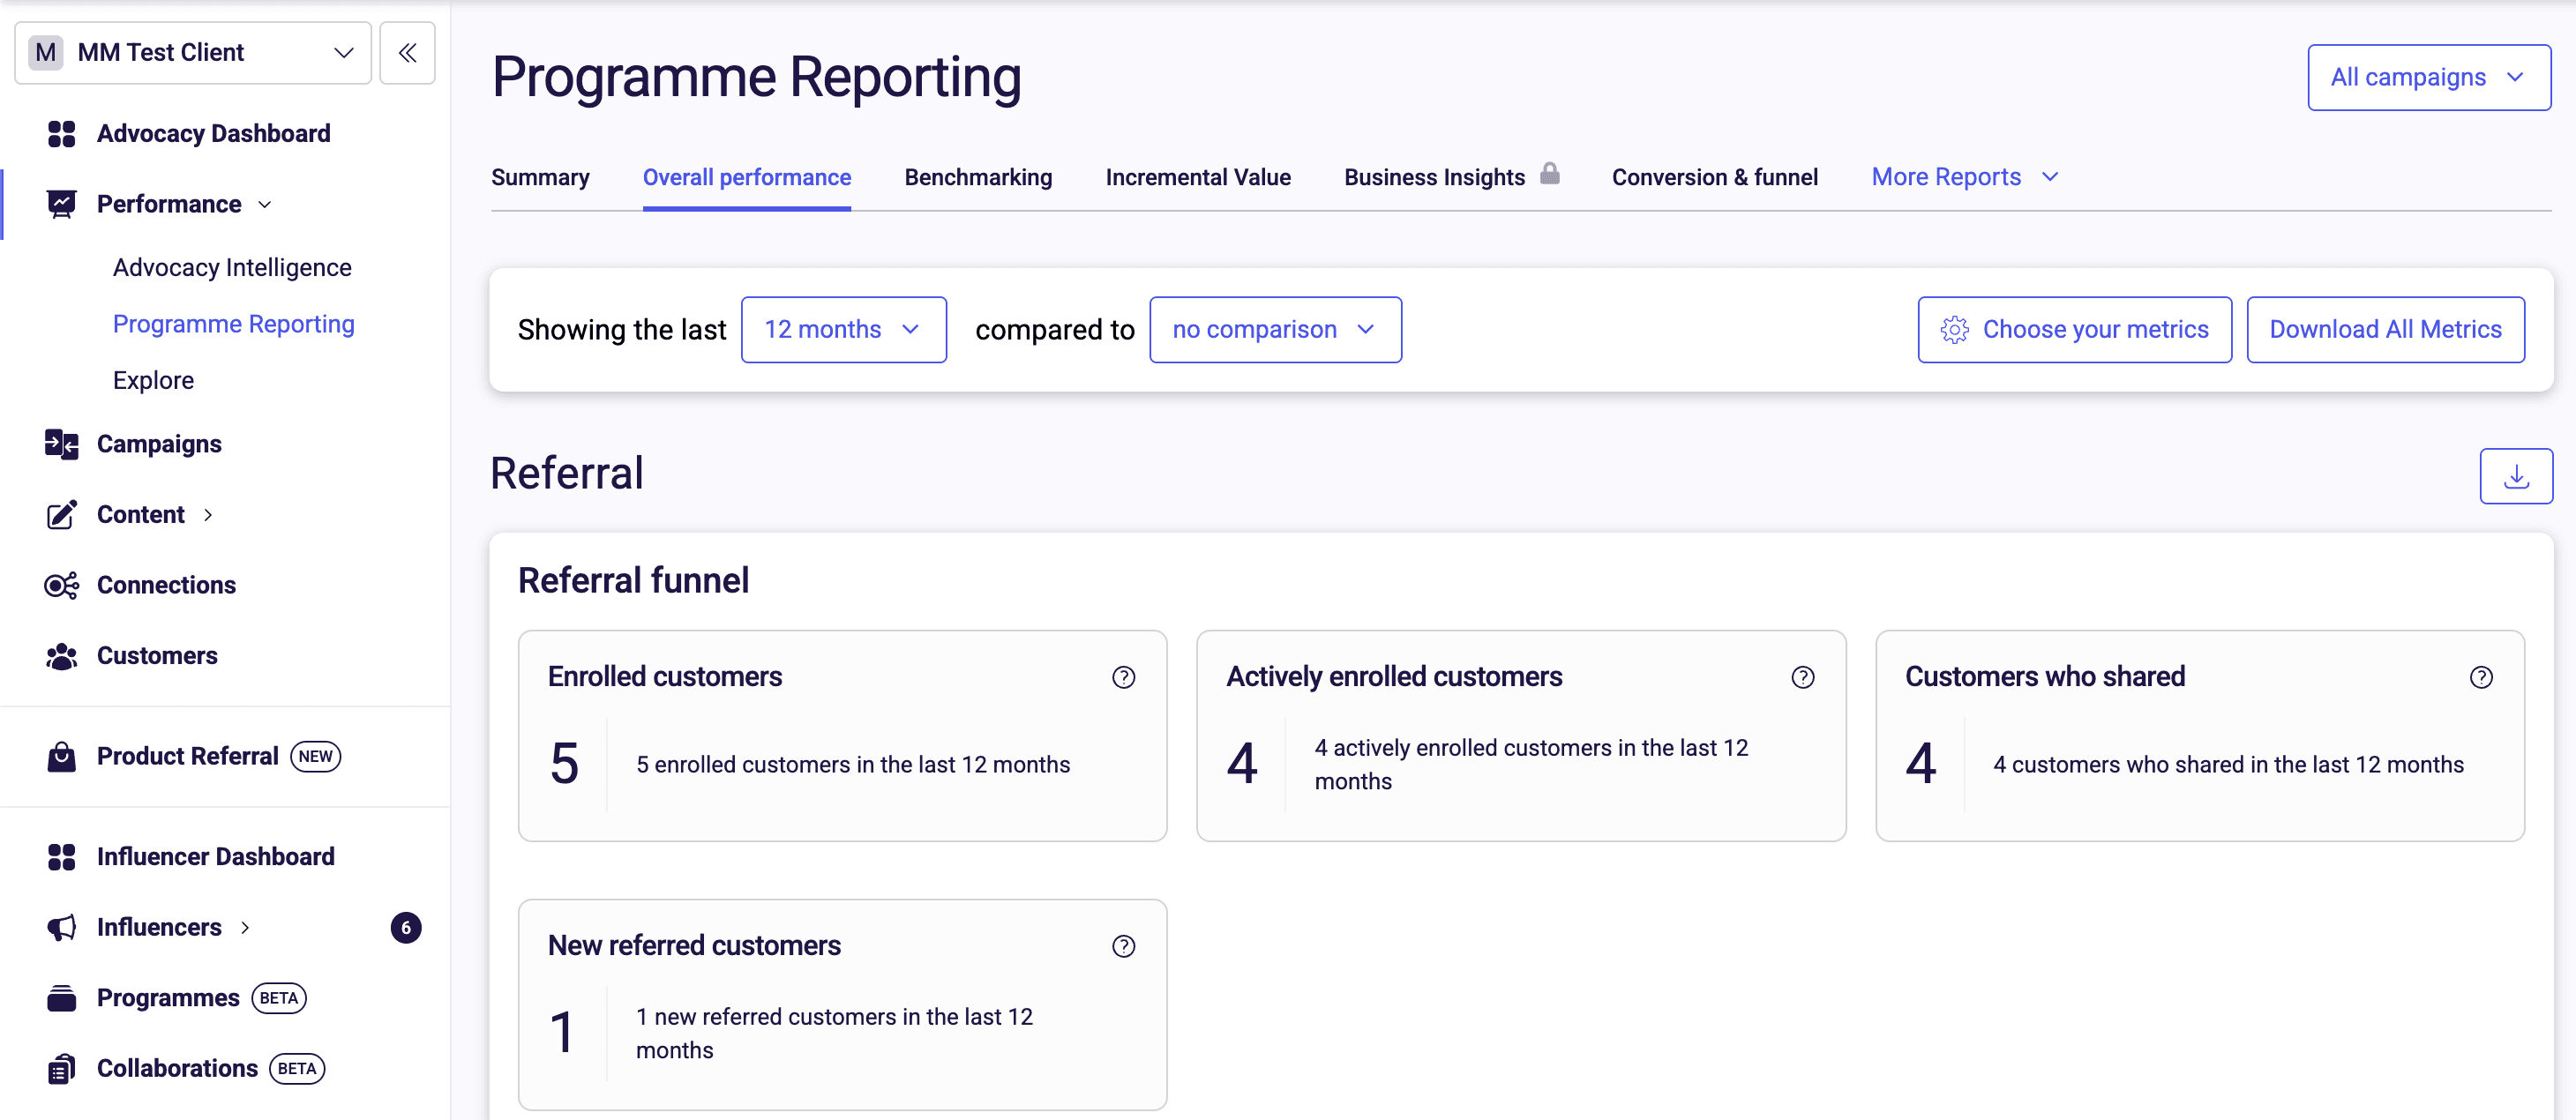 On this page you have:
* A **campaign selector**, so you can view all campaigns together or filter down to one (for example, if a merchant runs separate UK, France, and Spain campaigns)
* A **date picker**, with preset windows or the option to enter a custom date range
* The ability to add a **comparison** to any metric, either against the **prior year** or the **prior period** (the equivalent number of days immediately before your selected window)
* A **metric selector**, so you can add or remove metrics from the default view
Every metric also has a hover definition. Some of these definitions are more useful than others, which is where this article comes in. For a full reference of every metric tracked across the referral funnel, see the [Referral Metrics Glossary](/knowledge/reporting/referral/metrics-glossary).
## The Referral Funnel: End to End
The most useful way to read these metrics is end to end, as a funnel: each metric represents a stage further along the referral journey, from a customer seeing a referral offer through to a new customer completing their first order.
| Metric | What It Measures |
| --------------------------- | --------------------------------------------------------------------------------------------------------------------------------------------------------------------------------------------- |
| Orders | The total number of orders placed on the merchant's website in the selected window, regardless of whether they came through referral. This gives context on the overall size of the business. |
| Unique Impressions | How many individual customers have seen a referral offer, deduplicated to unique sessions. |
| Enrolled Customers | Customers who have seen a referral offer and been registered for referral, whether automatically ("silently") or by actively enrolling. |
| Actively Enrolled Customers | The subset of enrolled customers who actively chose to enrol, rather than being enrolled silently. |
| Customers Who Shared | Enrolled customers who have gone on to share their referral link. |
| Clicks | People who have clicked a shared link, or entered the name of the person who referred them. |
| Incented | Referees who have entered their email address and been given their incentive. This only means they've claimed it, not that they've used it. |
| Referee First Order | Referees who have gone on to place their first order - the final step in the funnel. |
A few of these are worth explaining further.
### Unique Impressions vs Impressions
Impressions and unique impressions are similar, but impressions are not deduplicated. If a customer refreshes the page showing the referral popup three times, that counts as four impressions but only one unique impression. Because unique impressions ties activity to unique sessions rather than counting every page load, it's the more reliable of the two metrics to use.
### Enrolled Customers vs Actively Enrolled Customers
At the post-purchase point, Mention Me automatically captures a customer's name and email address and registers them for referral without any action from the customer. This is called a **silent enrolment**.
Enrolled Customers is the combined total of:
* Customers who were silently enrolled at post-purchase
* Customers who actively enrolled, either by clicking through the post-purchase overlay or by manually registering on a landing page or dashboard
Actively Enrolled Customers counts only the second group: customers who have shown some level of engagement with the programme, rather than simply having a referral offer appear in front of them.
Comparing the two numbers is useful. If Enrolled Customers is far higher than Actively Enrolled Customers, it tells you that most customers have been registered but haven't yet meaningfully engaged with the programme.
Customers Who Shared can be under-reported. If a referrer tells a friend about a discount in conversation rather than through a formal share, that activity isn't automatically captured. If the referee later enters the referrer's name at checkout, Mention Me retrospectively credits that share.
Looking at Clicks alongside Customers Who Shared can also be revealing: roughly three clicks per share suggests a healthy amount of engagement with each share, though an unusually high ratio can also indicate that referral links are being posted somewhere public, such as a voucher code forum, rather than shared one-to-one.
## Revenue Metrics
The revenue metrics build on top of the funnel to show the financial impact of referral.
| Metric | What It Measures |
| --------------------------------------------- | ------------------------------------------------------------------------------------------------------------- |
| Revenue From All Customers | Revenue from every order on the merchant's website, referral and non-referral combined. |
| Revenue From New Customers | Revenue from a referee's first order. |
| Revenue From New Customers' Subsequent Orders | Revenue from a referee's second, third, and later orders. |
| Revenue From Rewarded Referrers | Revenue generated by a referrer within 45 days of receiving their own reward. |
| Total Referral Revenue | Revenue From New Customers + Revenue From New Customers' Subsequent Orders + Revenue From Rewarded Referrers. |
Total Referral Revenue is the headline figure typically shared with a client: for example, "over the last 30 days, Mention Me generated you £17,000, made up of £5,000 from new customer revenue, £12,000 from referees' subsequent orders, and a small amount from rewarded referrers."
At onboarding, clients are asked to share order values net of discounts and VAT, so revenue metrics should reflect revenue before discount. In practice, clients don't always set this up correctly on their side.
If you need to check whether a client's revenue figures include discounts, find a recent referral order in the Reports for Download section, look up its order number in the debug dashboard, and share that order number with the client. Ask them to confirm whether the value shown is before or after their discount. This is a reliable way to verify how their feed is configured.
Revenue From Rewarded Referrers has no direct link to the referrer's reward itself - it simply measures whatever the referrer spent within 45 days of receiving it. For clients whose referrer reward is a small, fixed-value gift card (for example, a £20 Amazon voucher from an insurer), this metric may not be especially meaningful, since the reward isn't tied to a purchase.
## Conversion Metrics
Conversion metrics express the funnel above as ratios.
**Share Rate** is Customers Who Shared as a percentage of Enrolled Customers. For example, a merchant with 35,000 enrolled customers and 1,600 who shared has a share rate of roughly 5%.
**Purchase Rate** is Referee First Orders as a percentage of shares. For example, a merchant generating 100 new customers from 1,600 shares has a purchase rate of roughly 6%.
**Conversion Rate** is Referee First Orders as a percentage of Enrolled Customers, showing overall drop-off across the whole journey.
Share Rate and Conversion Rate are both calculated from total Enrolled Customers, not from Actively Enrolled Customers. This is deliberate: both metrics are meant to show, of everyone who *could* share because they've been enrolled, how many actually did. Measuring from Actively Enrolled Customers alone would inflate the picture, since customers in that group have already shown intent to engage.
As a rough guide:
* A Share Rate of around 5% is acceptable; 10% is better
* A Purchase Rate of 20-30% is typical for a healthy programme
* A Conversion Rate of around 1% is a reasonable expectation
If Purchase Rate is low, the issue is more likely to sit on the referee's side of the journey than the referrer's, since Share Rate is about the referrer and Purchase Rate is about the referee. This is a useful place to focus when planning an A/B test. The reporting platform's Benchmarking section covers this in more detail - see [Understanding Referral Intelligence Benchmarks](/knowledge/ab-testing/benchmarking-test-ideas).
## Average Order Value
**New Customer AOV** is the average value of a referee's first order - Revenue From New Customers divided by the number of new referred customers.
**Non-Referred Customer AOV** is the average order value of orders that weren't placed as a result of referral.
Comparing the two is a useful story to tell a client, even when referral volumes are modest. If New Customer AOV is consistently higher than Non-Referred Customer AOV, it shows that the customers referral is generating spend more, on average, than the merchant's other customers.
## The Promotion Points Report
Alongside Overall Performance, the Promotion Points report shows where in the referral funnel activity is happening, broken down by touchpoint - for example, post-purchase, a banner in the account area, or a dedicated landing page. Touchpoints are tracked using `situation` parameters on referral URLs - see [Promotion Points & Situation Parameters](/knowledge/referral/promoting/promotion-points) for how these are set up.
On this page you have:
* A **campaign selector**, so you can view all campaigns together or filter down to one (for example, if a merchant runs separate UK, France, and Spain campaigns)
* A **date picker**, with preset windows or the option to enter a custom date range
* The ability to add a **comparison** to any metric, either against the **prior year** or the **prior period** (the equivalent number of days immediately before your selected window)
* A **metric selector**, so you can add or remove metrics from the default view
Every metric also has a hover definition. Some of these definitions are more useful than others, which is where this article comes in. For a full reference of every metric tracked across the referral funnel, see the [Referral Metrics Glossary](/knowledge/reporting/referral/metrics-glossary).
## The Referral Funnel: End to End
The most useful way to read these metrics is end to end, as a funnel: each metric represents a stage further along the referral journey, from a customer seeing a referral offer through to a new customer completing their first order.
| Metric | What It Measures |
| --------------------------- | --------------------------------------------------------------------------------------------------------------------------------------------------------------------------------------------- |
| Orders | The total number of orders placed on the merchant's website in the selected window, regardless of whether they came through referral. This gives context on the overall size of the business. |
| Unique Impressions | How many individual customers have seen a referral offer, deduplicated to unique sessions. |
| Enrolled Customers | Customers who have seen a referral offer and been registered for referral, whether automatically ("silently") or by actively enrolling. |
| Actively Enrolled Customers | The subset of enrolled customers who actively chose to enrol, rather than being enrolled silently. |
| Customers Who Shared | Enrolled customers who have gone on to share their referral link. |
| Clicks | People who have clicked a shared link, or entered the name of the person who referred them. |
| Incented | Referees who have entered their email address and been given their incentive. This only means they've claimed it, not that they've used it. |
| Referee First Order | Referees who have gone on to place their first order - the final step in the funnel. |
A few of these are worth explaining further.
### Unique Impressions vs Impressions
Impressions and unique impressions are similar, but impressions are not deduplicated. If a customer refreshes the page showing the referral popup three times, that counts as four impressions but only one unique impression. Because unique impressions ties activity to unique sessions rather than counting every page load, it's the more reliable of the two metrics to use.
### Enrolled Customers vs Actively Enrolled Customers
At the post-purchase point, Mention Me automatically captures a customer's name and email address and registers them for referral without any action from the customer. This is called a **silent enrolment**.
Enrolled Customers is the combined total of:
* Customers who were silently enrolled at post-purchase
* Customers who actively enrolled, either by clicking through the post-purchase overlay or by manually registering on a landing page or dashboard
Actively Enrolled Customers counts only the second group: customers who have shown some level of engagement with the programme, rather than simply having a referral offer appear in front of them.
Comparing the two numbers is useful. If Enrolled Customers is far higher than Actively Enrolled Customers, it tells you that most customers have been registered but haven't yet meaningfully engaged with the programme.
Customers Who Shared can be under-reported. If a referrer tells a friend about a discount in conversation rather than through a formal share, that activity isn't automatically captured. If the referee later enters the referrer's name at checkout, Mention Me retrospectively credits that share.
Looking at Clicks alongside Customers Who Shared can also be revealing: roughly three clicks per share suggests a healthy amount of engagement with each share, though an unusually high ratio can also indicate that referral links are being posted somewhere public, such as a voucher code forum, rather than shared one-to-one.
## Revenue Metrics
The revenue metrics build on top of the funnel to show the financial impact of referral.
| Metric | What It Measures |
| --------------------------------------------- | ------------------------------------------------------------------------------------------------------------- |
| Revenue From All Customers | Revenue from every order on the merchant's website, referral and non-referral combined. |
| Revenue From New Customers | Revenue from a referee's first order. |
| Revenue From New Customers' Subsequent Orders | Revenue from a referee's second, third, and later orders. |
| Revenue From Rewarded Referrers | Revenue generated by a referrer within 45 days of receiving their own reward. |
| Total Referral Revenue | Revenue From New Customers + Revenue From New Customers' Subsequent Orders + Revenue From Rewarded Referrers. |
Total Referral Revenue is the headline figure typically shared with a client: for example, "over the last 30 days, Mention Me generated you £17,000, made up of £5,000 from new customer revenue, £12,000 from referees' subsequent orders, and a small amount from rewarded referrers."
At onboarding, clients are asked to share order values net of discounts and VAT, so revenue metrics should reflect revenue before discount. In practice, clients don't always set this up correctly on their side.
If you need to check whether a client's revenue figures include discounts, find a recent referral order in the Reports for Download section, look up its order number in the debug dashboard, and share that order number with the client. Ask them to confirm whether the value shown is before or after their discount. This is a reliable way to verify how their feed is configured.
Revenue From Rewarded Referrers has no direct link to the referrer's reward itself - it simply measures whatever the referrer spent within 45 days of receiving it. For clients whose referrer reward is a small, fixed-value gift card (for example, a £20 Amazon voucher from an insurer), this metric may not be especially meaningful, since the reward isn't tied to a purchase.
## Conversion Metrics
Conversion metrics express the funnel above as ratios.
**Share Rate** is Customers Who Shared as a percentage of Enrolled Customers. For example, a merchant with 35,000 enrolled customers and 1,600 who shared has a share rate of roughly 5%.
**Purchase Rate** is Referee First Orders as a percentage of shares. For example, a merchant generating 100 new customers from 1,600 shares has a purchase rate of roughly 6%.
**Conversion Rate** is Referee First Orders as a percentage of Enrolled Customers, showing overall drop-off across the whole journey.
Share Rate and Conversion Rate are both calculated from total Enrolled Customers, not from Actively Enrolled Customers. This is deliberate: both metrics are meant to show, of everyone who *could* share because they've been enrolled, how many actually did. Measuring from Actively Enrolled Customers alone would inflate the picture, since customers in that group have already shown intent to engage.
As a rough guide:
* A Share Rate of around 5% is acceptable; 10% is better
* A Purchase Rate of 20-30% is typical for a healthy programme
* A Conversion Rate of around 1% is a reasonable expectation
If Purchase Rate is low, the issue is more likely to sit on the referee's side of the journey than the referrer's, since Share Rate is about the referrer and Purchase Rate is about the referee. This is a useful place to focus when planning an A/B test. The reporting platform's Benchmarking section covers this in more detail - see [Understanding Referral Intelligence Benchmarks](/knowledge/ab-testing/benchmarking-test-ideas).
## Average Order Value
**New Customer AOV** is the average value of a referee's first order - Revenue From New Customers divided by the number of new referred customers.
**Non-Referred Customer AOV** is the average order value of orders that weren't placed as a result of referral.
Comparing the two is a useful story to tell a client, even when referral volumes are modest. If New Customer AOV is consistently higher than Non-Referred Customer AOV, it shows that the customers referral is generating spend more, on average, than the merchant's other customers.
## The Promotion Points Report
Alongside Overall Performance, the Promotion Points report shows where in the referral funnel activity is happening, broken down by touchpoint - for example, post-purchase, a banner in the account area, or a dedicated landing page. Touchpoints are tracked using `situation` parameters on referral URLs - see [Promotion Points & Situation Parameters](/knowledge/referral/promoting/promotion-points) for how these are set up.
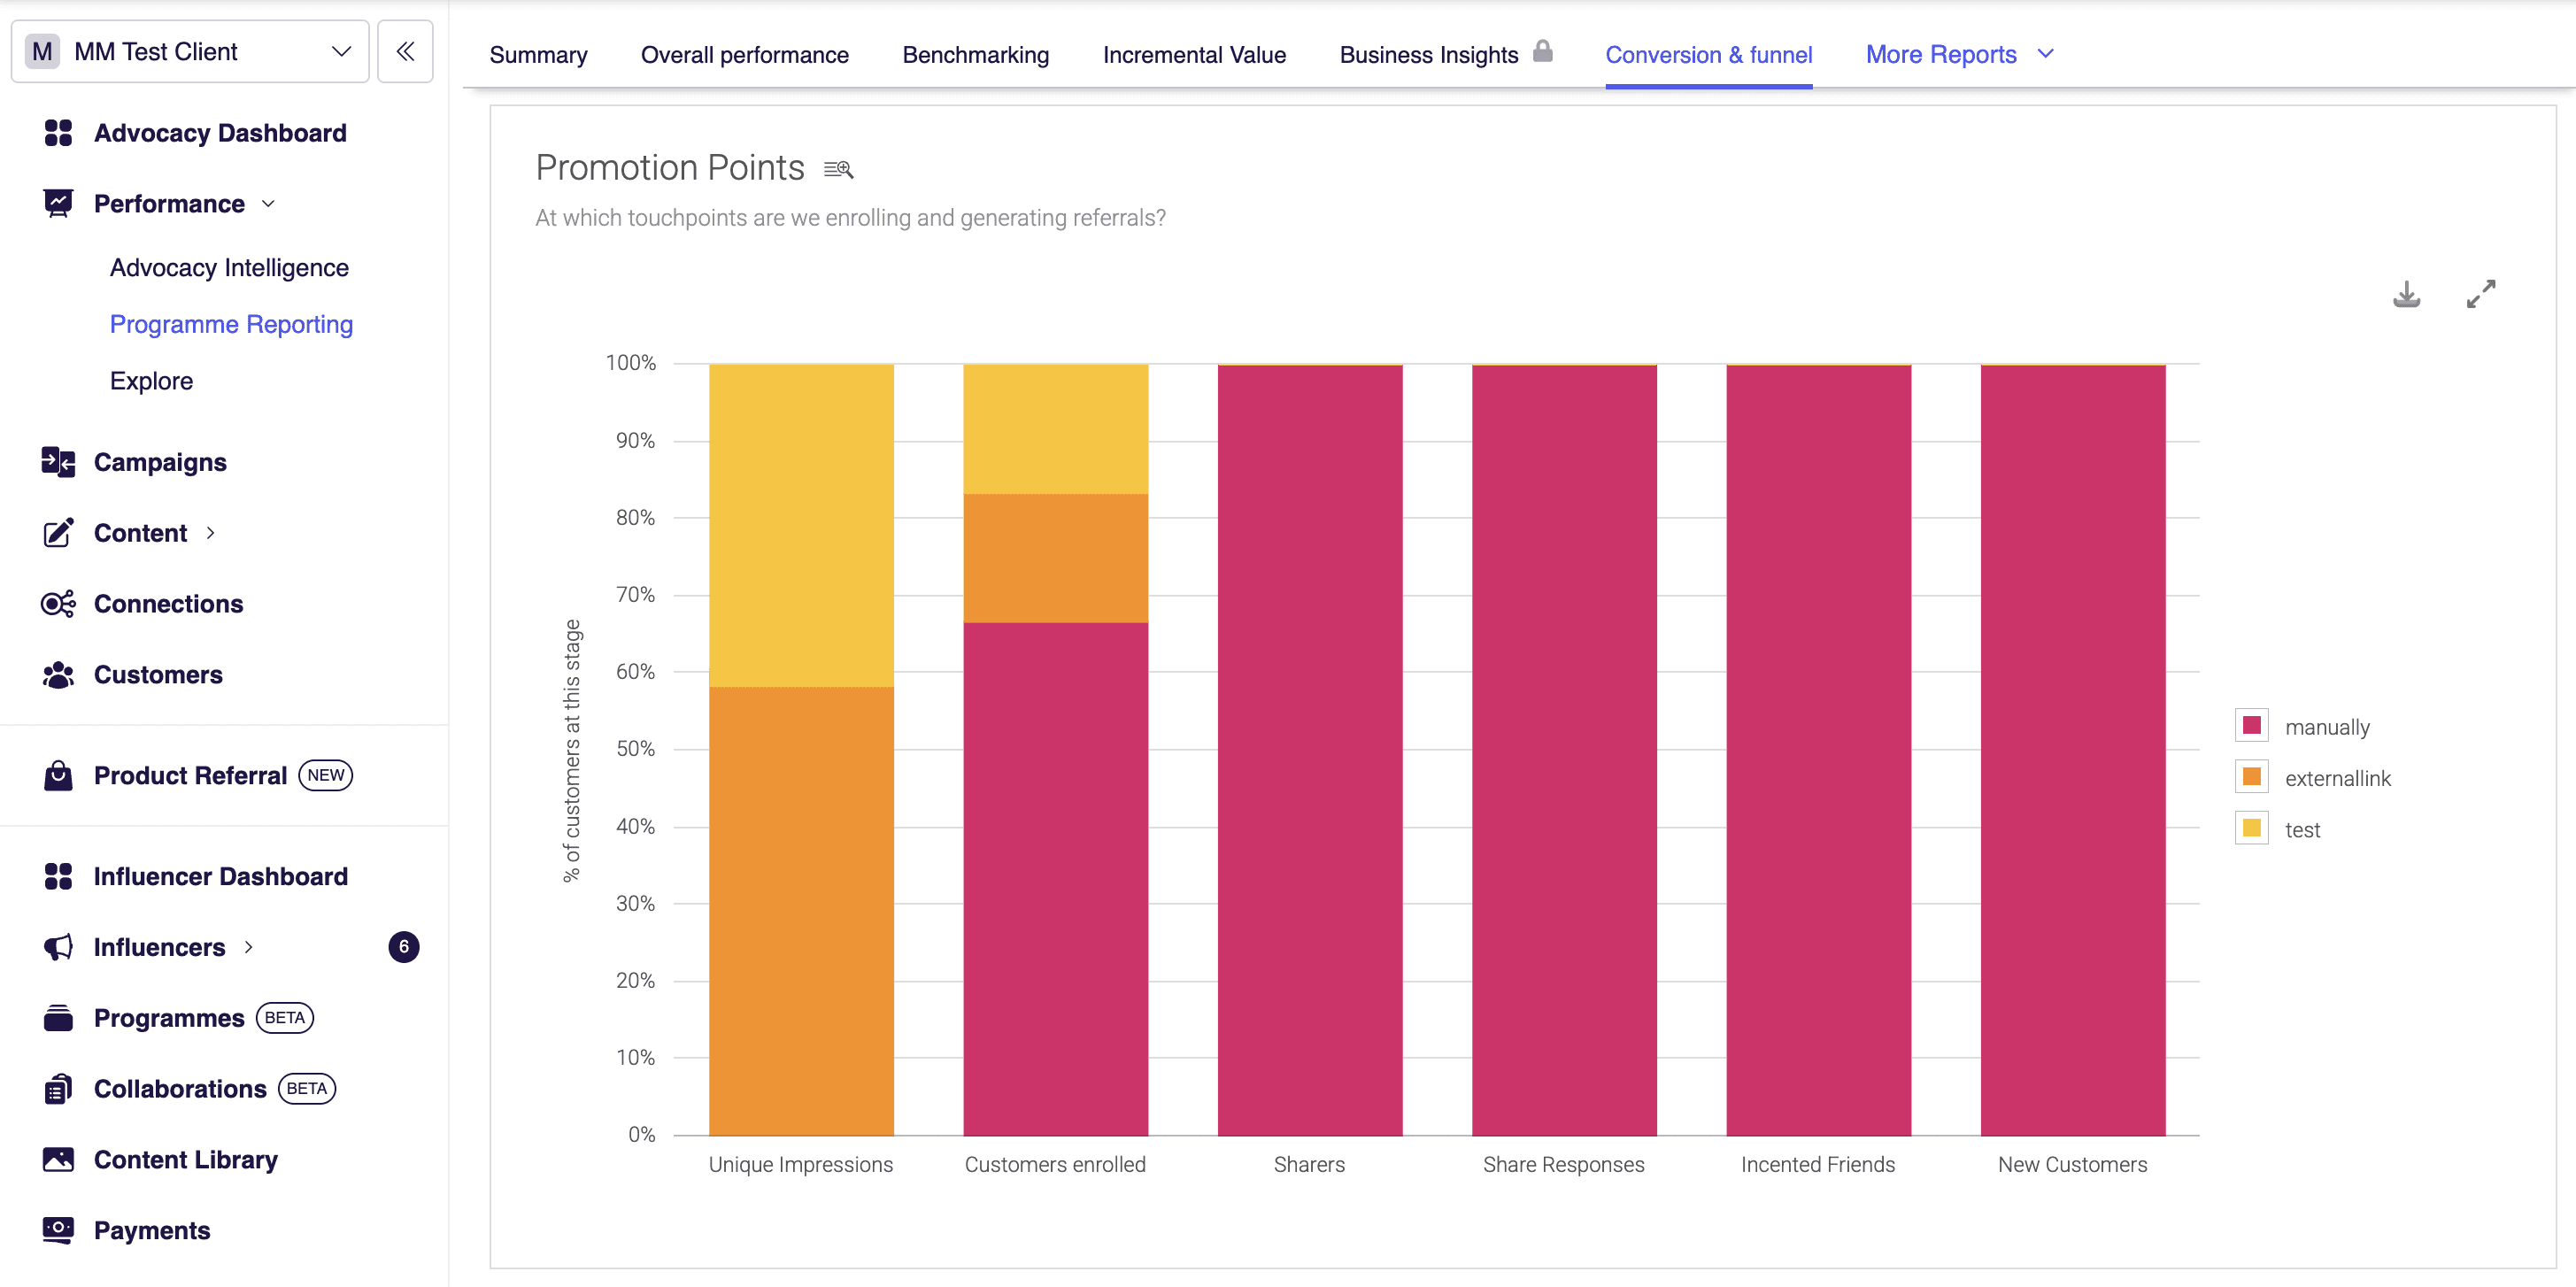 This report is useful for spotting imbalance. If the large majority of impressions (for example, 96%) are happening at a single touchpoint such as post-purchase, that suggests referral isn't being promoted enough elsewhere - in emails, on dedicated pages, or in other places on the site. Talking about referral in more places is generally a good sign.
It's also worth checking where new customers are actually coming from, not just impressions. A touchpoint that isn't promoted heavily, such as an account-area banner or a landing page, can still contribute a disproportionate share of new customers relative to how little it's used, which is a signal that it's worth investing in further.
As a rough guide, if post-purchase accounts for 60% or less of new customers generated through referral, that's a good sign: it means the other 40% or more is coming from other touchpoints, which shows referral is being promoted well across the site.
The Overall Performance report also includes a set of graphs, which visualise the metrics covered in this article over time.
## See Also
Definitions for every metric tracked across the referral funnel, from impressions and enrolment through to conversions and revenue.
Compare your funnel metrics against industry averages and find targeted test ideas for improving them.
Build custom reports in the Explore section and break performance down by promotion point, share method, and segment.
Set up situation parameters on referral URLs so activity can be tracked by touchpoint.
This report is useful for spotting imbalance. If the large majority of impressions (for example, 96%) are happening at a single touchpoint such as post-purchase, that suggests referral isn't being promoted enough elsewhere - in emails, on dedicated pages, or in other places on the site. Talking about referral in more places is generally a good sign.
It's also worth checking where new customers are actually coming from, not just impressions. A touchpoint that isn't promoted heavily, such as an account-area banner or a landing page, can still contribute a disproportionate share of new customers relative to how little it's used, which is a signal that it's worth investing in further.
As a rough guide, if post-purchase accounts for 60% or less of new customers generated through referral, that's a good sign: it means the other 40% or more is coming from other touchpoints, which shows referral is being promoted well across the site.
The Overall Performance report also includes a set of graphs, which visualise the metrics covered in this article over time.
## See Also
Definitions for every metric tracked across the referral funnel, from impressions and enrolment through to conversions and revenue.
Compare your funnel metrics against industry averages and find targeted test ideas for improving them.
Build custom reports in the Explore section and break performance down by promotion point, share method, and segment.
Set up situation parameters on referral URLs so activity can be tracked by touchpoint.