> ## Documentation Index
> Fetch the complete documentation index at: https://docs.mention-me.com/llms.txt
> Use this file to discover all available pages before exploring further.
# Top Performers Report
> How to use the Top Performers report to analyse your highest-performing creatives with advanced filters, metrics, and groupings.
The Top Performers report helps you drive meaningful insights at scale by analysing your highest-performing creatives using advanced filters, key metrics, and segment groupings.
## Creating a Top Performers Report
1. Click **Create Report** and select **Top Performers**.
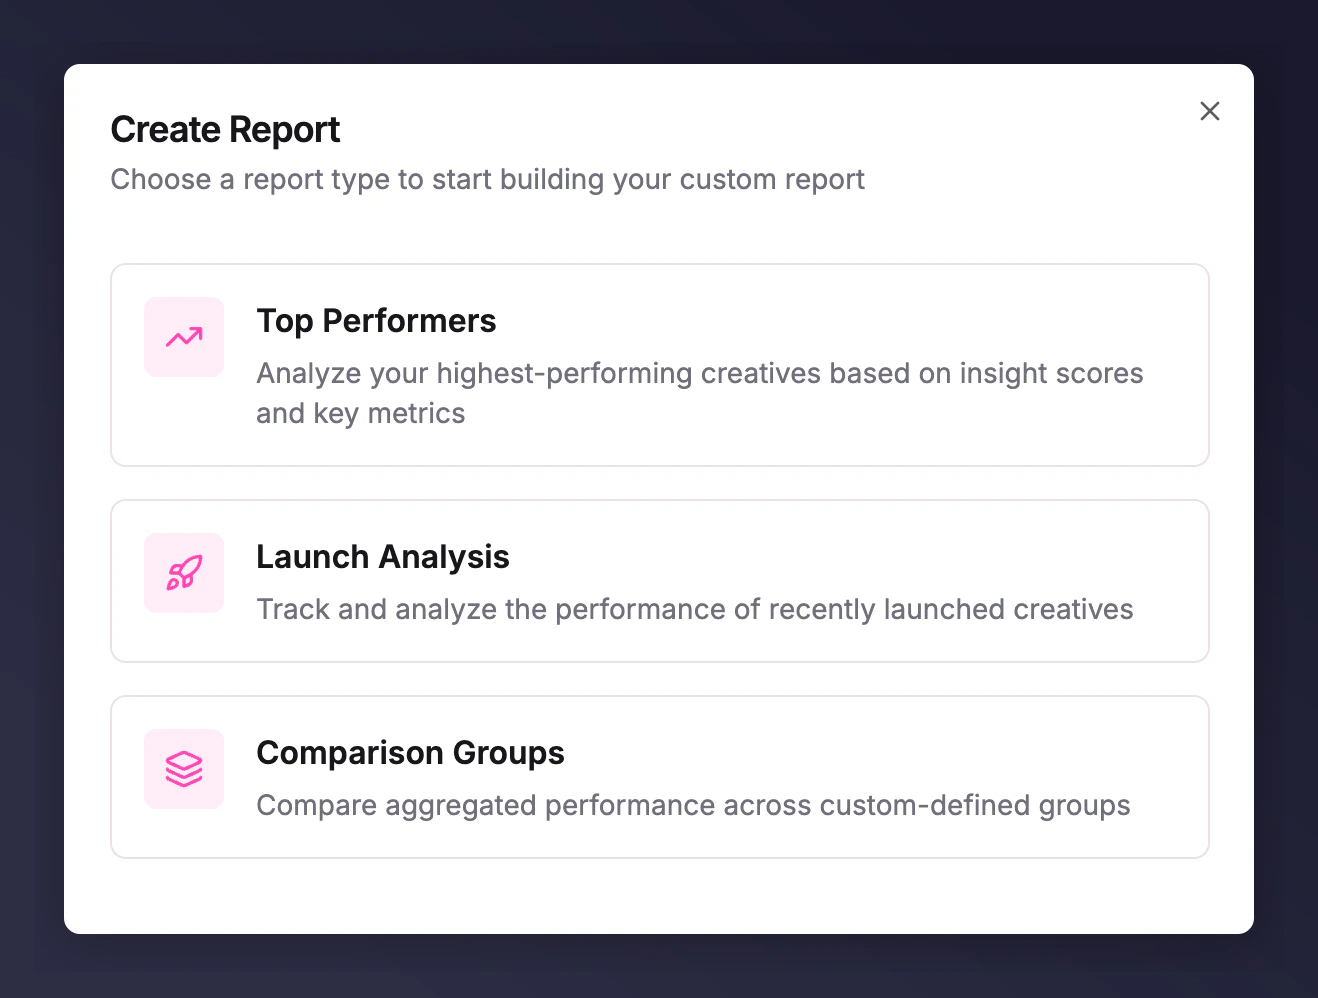 2. Select which platform (Meta or TikTok) you want to create it for.
## Using the Report
2. Select which platform (Meta or TikTok) you want to create it for.
## Using the Report
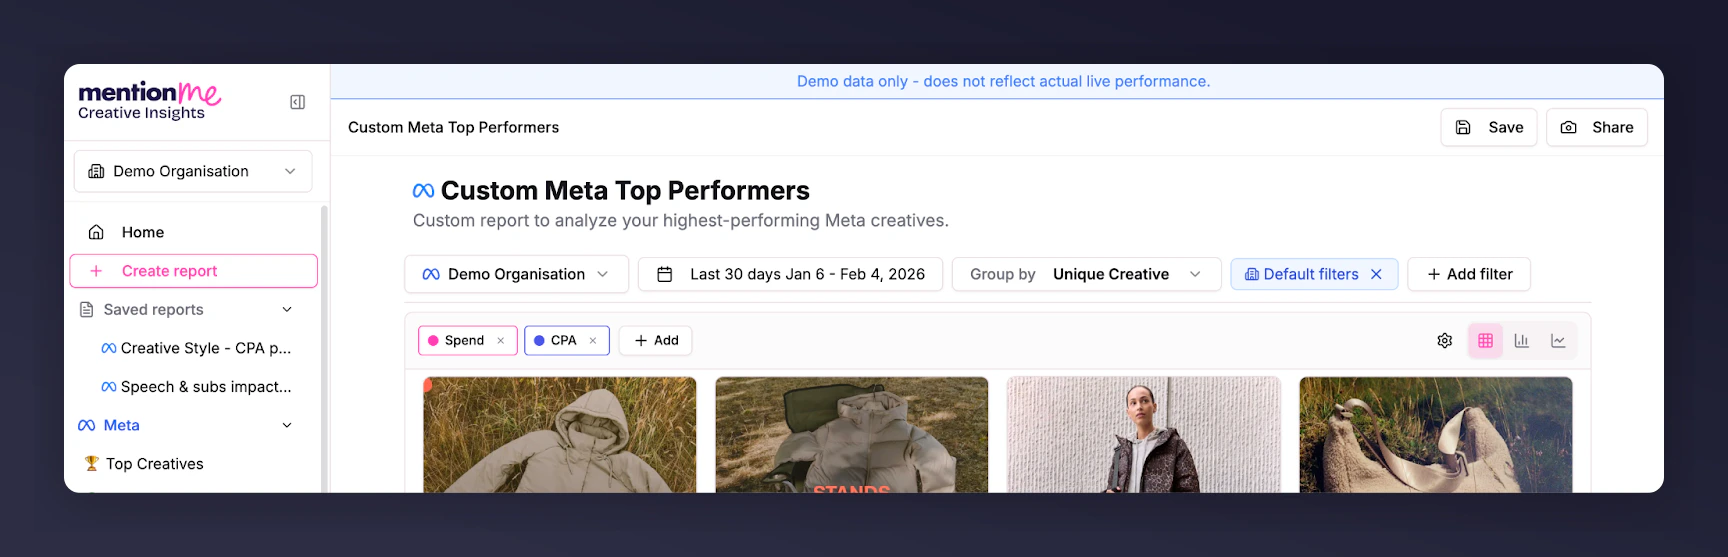 * Select your timeframe using the date picker.
* Choose metrics to include by clicking the **+ add** button.
* Add filters and group your ads in a variety of ways (see below).
## Grouping Performance Variables
To the right of the date picker, **Group by** lets you select any campaign variable to aggregate your data. This gives you a deeper understanding of key performance drivers and lets you compare segments quickly.
* **Group by Ad/Adset/Campaign setup variables**: See which ad names perform best or which campaign objectives are driving the most scale.
* **Group by Copy elements**: Find out which headlines perform best.
* **Group by Naming Rule Tags**: [How to set up and use Naming Rule Tags](/knowledge/reporting/creative-insights/naming-rule-tags).
* **Group by Creative Breakdowns**: AI-driven categories to help you understand how human presence, logo, and text prominence impact performance. Available for paid customers upon request; contact your Account Management team.
## Advanced Filters
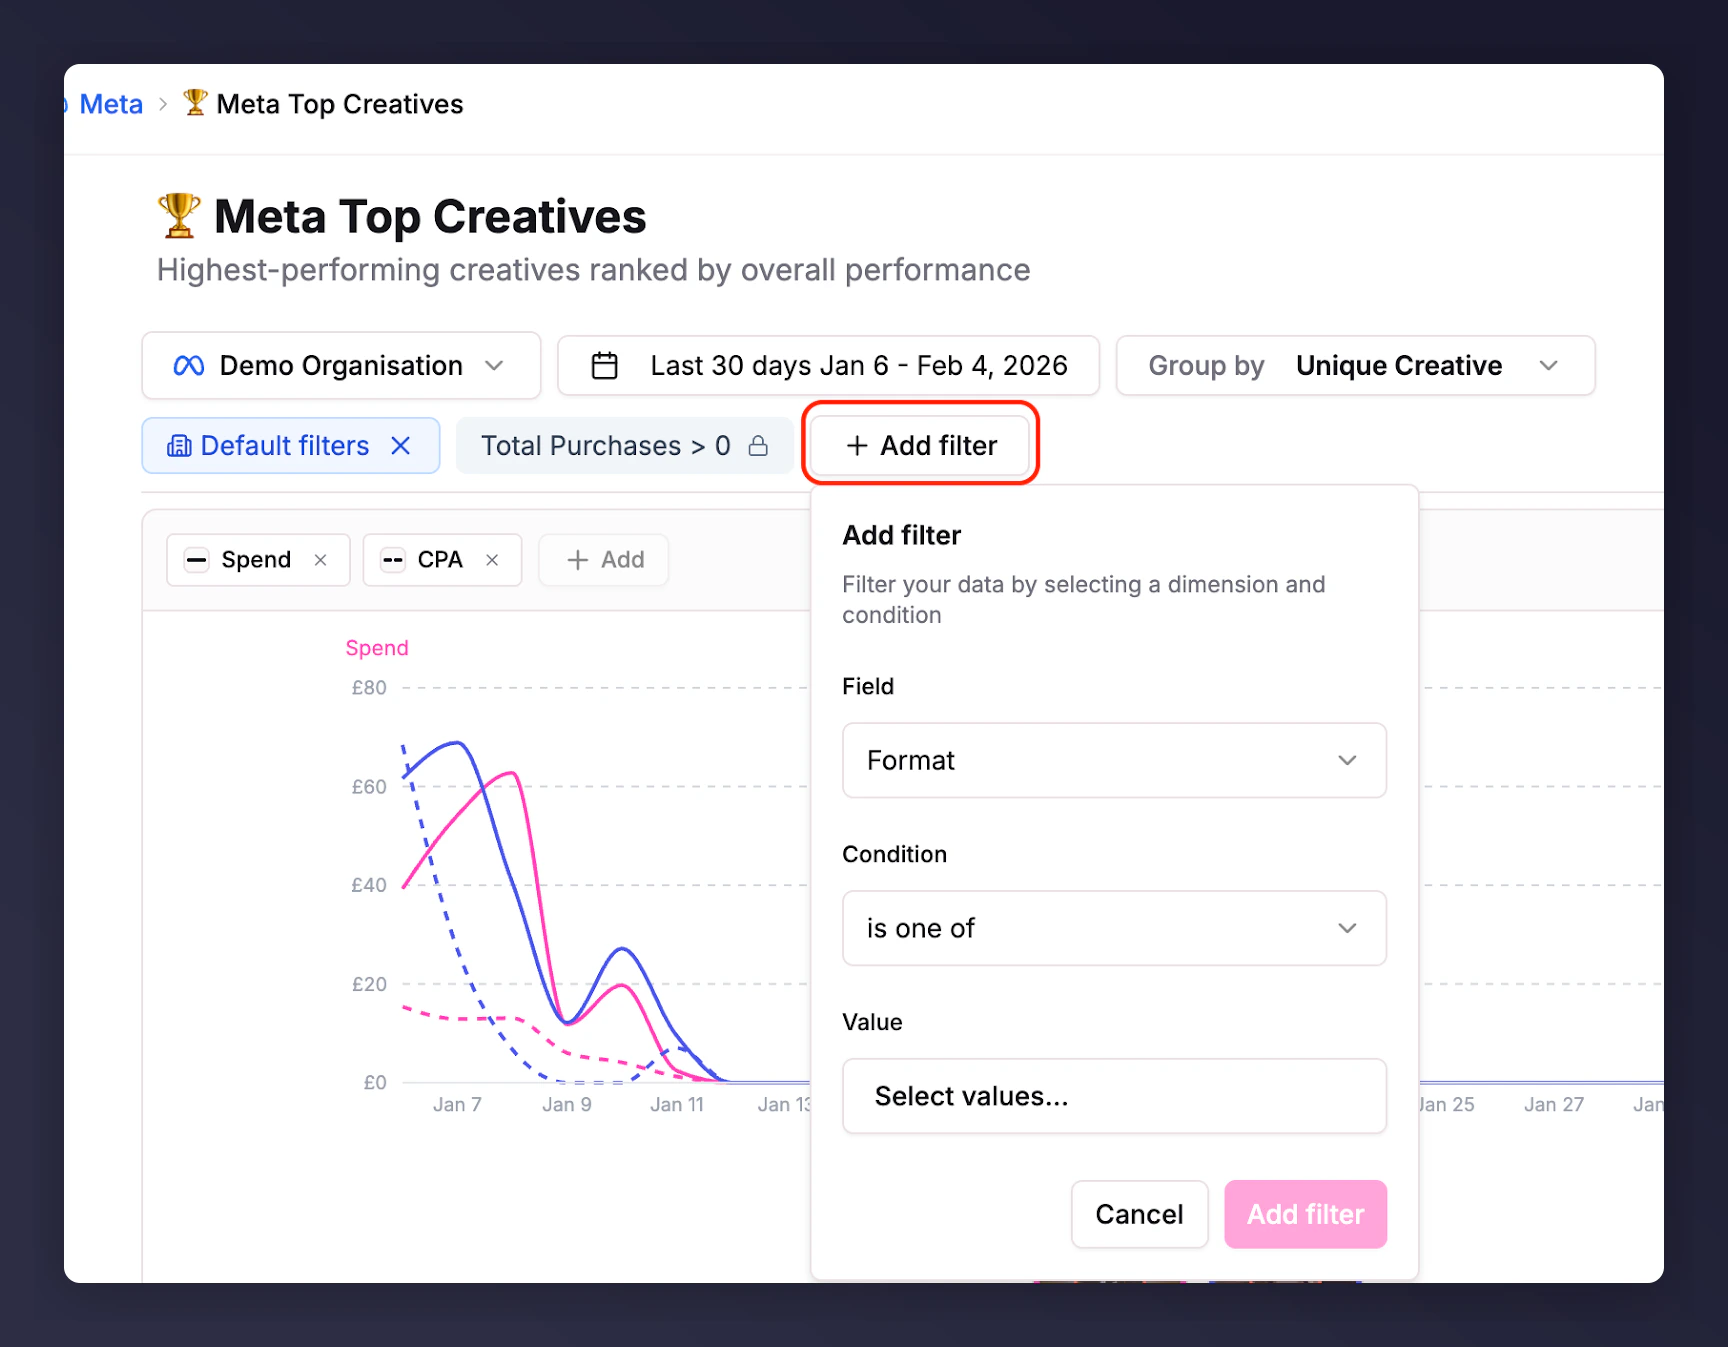
Click **+ Add filter** to slice your data.
* Choose any field -- campaign structure variables (e.g. format, campaign name) or metrics (e.g. CPA, CPC).
* Set conditions: for metrics, filter by greater than or less than values. For campaign variables, use text matching (e.g. campaign "contains X") or select specific values.
* Remove filters by clicking the **x** next to the metric name above the visualisation.
* Select your timeframe using the date picker.
* Choose metrics to include by clicking the **+ add** button.
* Add filters and group your ads in a variety of ways (see below).
## Grouping Performance Variables
To the right of the date picker, **Group by** lets you select any campaign variable to aggregate your data. This gives you a deeper understanding of key performance drivers and lets you compare segments quickly.
* **Group by Ad/Adset/Campaign setup variables**: See which ad names perform best or which campaign objectives are driving the most scale.
* **Group by Copy elements**: Find out which headlines perform best.
* **Group by Naming Rule Tags**: [How to set up and use Naming Rule Tags](/knowledge/reporting/creative-insights/naming-rule-tags).
* **Group by Creative Breakdowns**: AI-driven categories to help you understand how human presence, logo, and text prominence impact performance. Available for paid customers upon request; contact your Account Management team.
## Advanced Filters
Click **+ Add filter** to slice your data.
* Choose any field -- campaign structure variables (e.g. format, campaign name) or metrics (e.g. CPA, CPC).
* Set conditions: for metrics, filter by greater than or less than values. For campaign variables, use text matching (e.g. campaign "contains X") or select specific values.
* Remove filters by clicking the **x** next to the metric name above the visualisation.
 ## Visualisation Options
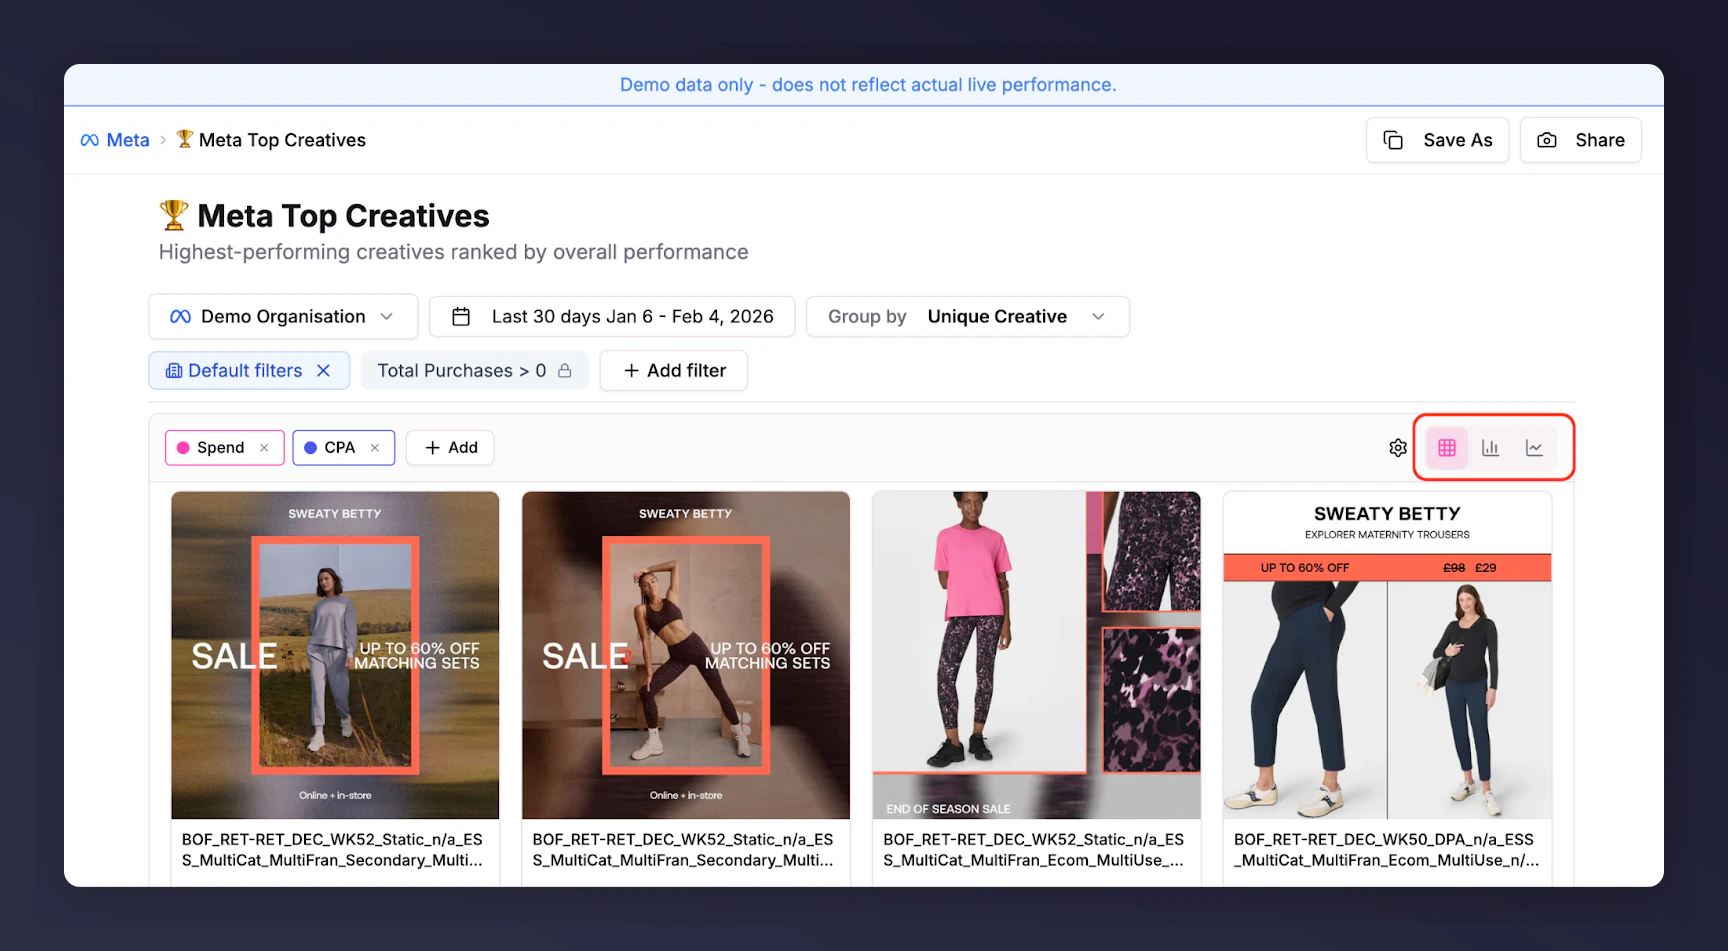
Select Grid, Bar chart, or Timeline views.
* **Grid view** (default): Quantitative and qualitative view of your creatives so you can make changes without searching for a preview.
* **Bar chart view**: Thumbnail for easier comparison of metric performance by ad or segment.
* **Timeline view**: Visualise peaks and troughs of performance. Useful with CTR vs Spend metrics to spot ad fatigue.
## Visualisation Options
Select Grid, Bar chart, or Timeline views.
* **Grid view** (default): Quantitative and qualitative view of your creatives so you can make changes without searching for a preview.
* **Bar chart view**: Thumbnail for easier comparison of metric performance by ad or segment.
* **Timeline view**: Visualise peaks and troughs of performance. Useful with CTR vs Spend metrics to spot ad fatigue.
 ## Templated Reports
Pre-built reports are available in the side panel for both Meta and TikTok:
* **Top Creatives**: Grouped at creative level to see your highest performers.
* **All Active**: Shows what's live now.
* **Top Hooks**: Which ads are best at stopping the scroll.
* **Top Clicks**: Which ads generate the most clicks.
* **Top Copy**: An overview of messaging to drive improvements in copy.
## Templated Reports
Pre-built reports are available in the side panel for both Meta and TikTok:
* **Top Creatives**: Grouped at creative level to see your highest performers.
* **All Active**: Shows what's live now.
* **Top Hooks**: Which ads are best at stopping the scroll.
* **Top Clicks**: Which ads generate the most clicks.
* **Top Copy**: An overview of messaging to drive improvements in copy.