> ## Documentation Index
> Fetch the complete documentation index at: https://docs.mention-me.com/llms.txt
> Use this file to discover all available pages before exploring further.
# Understanding Propensity to Refer
> How Mention Me's Propensity to Refer data model segments customers by their likelihood to refer and optimises their post-purchase experience.
The Propensity to Refer data model is a customer segmentation tool that predicts each customer's likelihood to refer at the point of purchase.
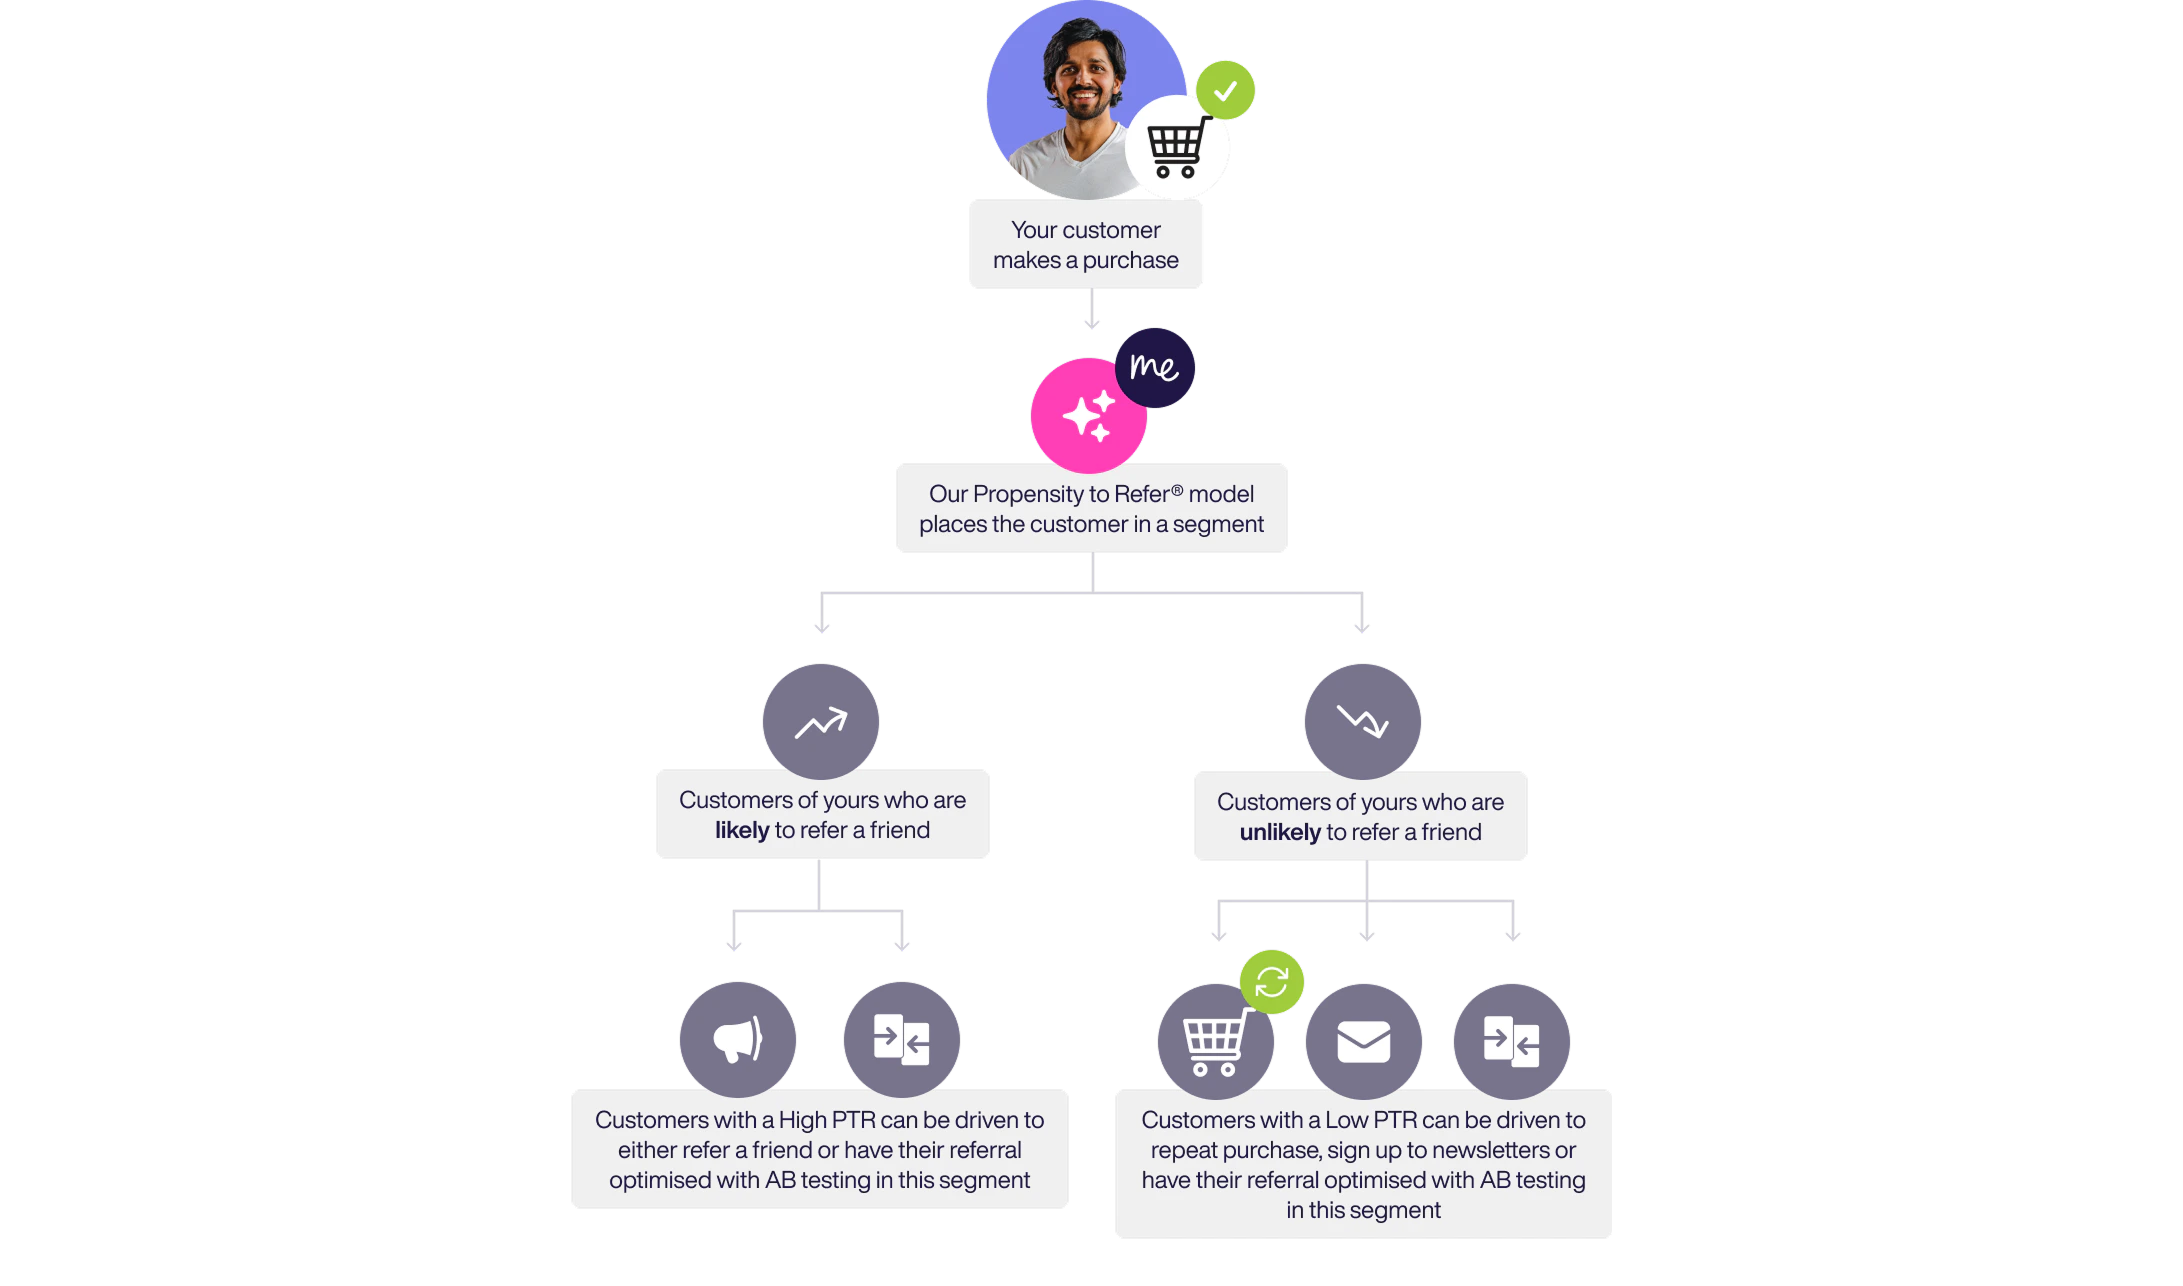 ## How does it work?
Each customer is segmented into one of two groups: those with a High Propensity to Refer and those with a Low Propensity to Refer.
The model updates weekly to use the most relevant and up-to-date information. It adapts dynamically to changing customer behaviour.
These groups are shown different experiences optimised for conversion: **High Propensity to Refer** customers are shown referral offers, while **Low Propensity to Refer** customers are shown alternative actions based on business goals.
## Example drivers used to predict customer behaviour
| Driver | Impact on Prediction |
| ------------------------------ | -------------------- |
| Currency | Very high |
| Number of past orders | High |
| Marketing opt-in status | High |
| Operating system | Medium |
| Revenue from most recent order | Medium |
| Number of past shares | Low |
### Alternative actions are based on 3 business goals
* Show a discount on the next order to increase repeat revenue
* Show a newsletter sign-up to grow the marketing database
* Present incentives tailored to each segment to optimise referrals and increase revenue
### Key terminology
* **High Propensity to Refer (High PTR):** Customers most likely to refer. Usually shown a referral offer.
* **Low Propensity to Refer (Low PTR):** Customers least likely to refer. Usually shown an alternative option (e.g. IFA, NPS).
* **Control:** Customers who qualify as Low PTR but are shown a referral offer. Used for experimental comparison:
* Measures effectiveness of alternate actions and revenue trade-offs.
* Improves future predictive model accuracy by observing reaction to referral offer.
## How do we calculate the additional value?
We compare the performance of the **Low PTR** group receiving an alternative action with the **Control** group receiving a referral offer.
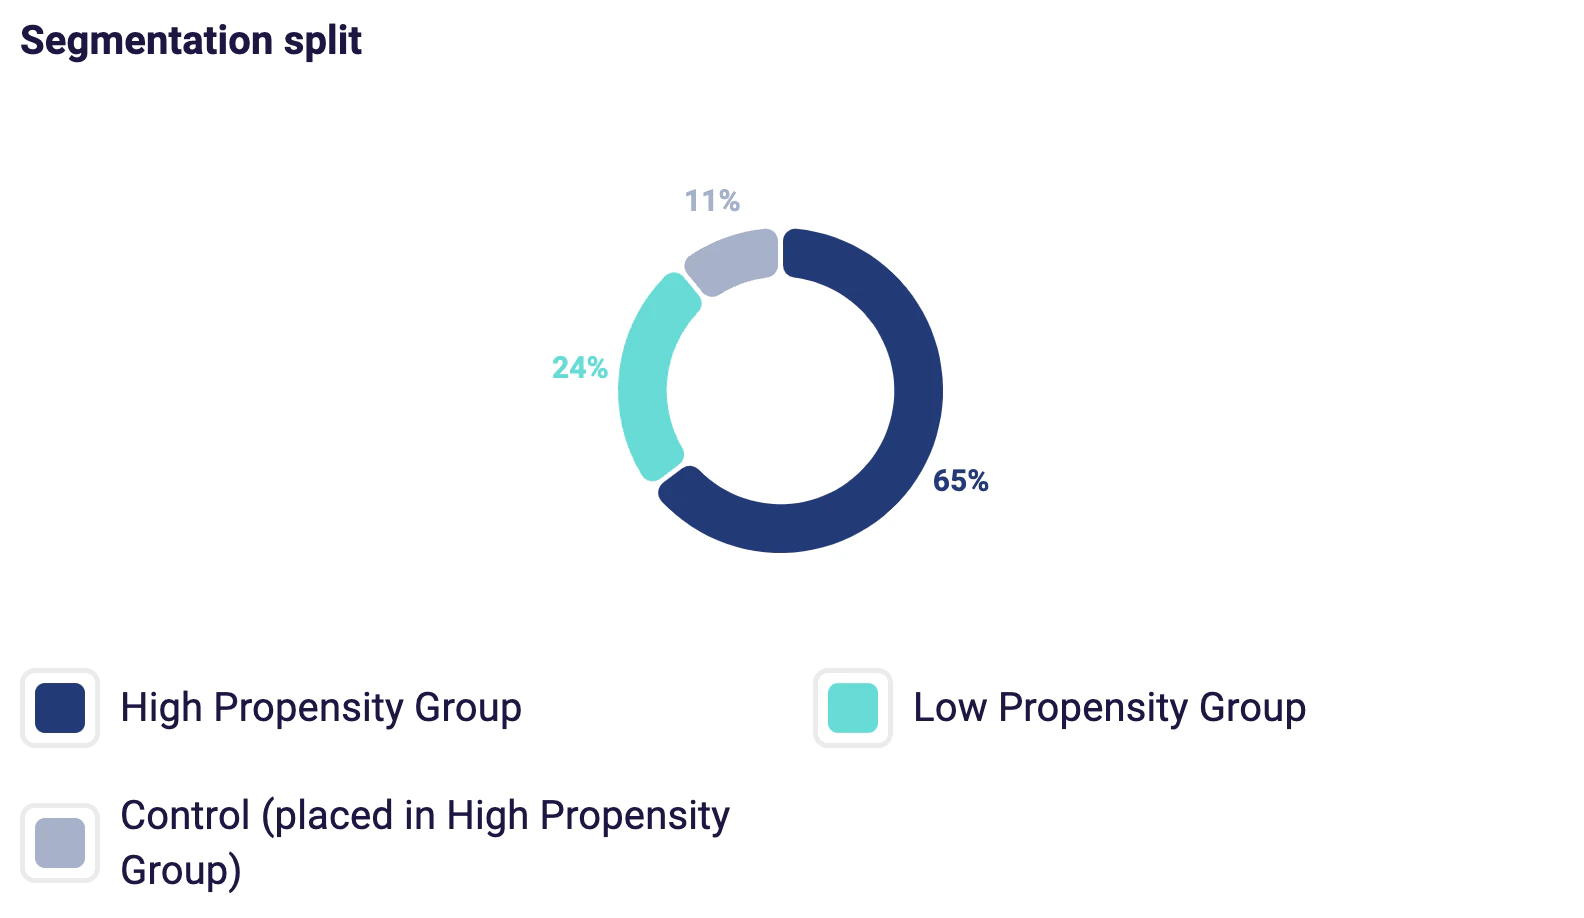
## How are your customers being segmented?
The following example shows an aggregated view of the proportion of customers by propensity group. Proportions may vary at the experiment level.
## How does it work?
Each customer is segmented into one of two groups: those with a High Propensity to Refer and those with a Low Propensity to Refer.
The model updates weekly to use the most relevant and up-to-date information. It adapts dynamically to changing customer behaviour.
These groups are shown different experiences optimised for conversion: **High Propensity to Refer** customers are shown referral offers, while **Low Propensity to Refer** customers are shown alternative actions based on business goals.
## Example drivers used to predict customer behaviour
| Driver | Impact on Prediction |
| ------------------------------ | -------------------- |
| Currency | Very high |
| Number of past orders | High |
| Marketing opt-in status | High |
| Operating system | Medium |
| Revenue from most recent order | Medium |
| Number of past shares | Low |
### Alternative actions are based on 3 business goals
* Show a discount on the next order to increase repeat revenue
* Show a newsletter sign-up to grow the marketing database
* Present incentives tailored to each segment to optimise referrals and increase revenue
### Key terminology
* **High Propensity to Refer (High PTR):** Customers most likely to refer. Usually shown a referral offer.
* **Low Propensity to Refer (Low PTR):** Customers least likely to refer. Usually shown an alternative option (e.g. IFA, NPS).
* **Control:** Customers who qualify as Low PTR but are shown a referral offer. Used for experimental comparison:
* Measures effectiveness of alternate actions and revenue trade-offs.
* Improves future predictive model accuracy by observing reaction to referral offer.
## How do we calculate the additional value?
We compare the performance of the **Low PTR** group receiving an alternative action with the **Control** group receiving a referral offer.
## How are your customers being segmented?
The following example shows an aggregated view of the proportion of customers by propensity group. Proportions may vary at the experiment level.