> ## Documentation Index
> Fetch the complete documentation index at: https://docs.mention-me.com/llms.txt
> Use this file to discover all available pages before exploring further.
# Templates
> The five starter dashboards and what each one answers.
Five templates are available when you pick **Browse templates** in the New dashboard dialog. Each one is a starting point: once created, you can add, remove, or reshape any tile.
For the steps to create from a template, see [start from a template](/knowledge-v2/referral/reporting/get-started/using-templates).
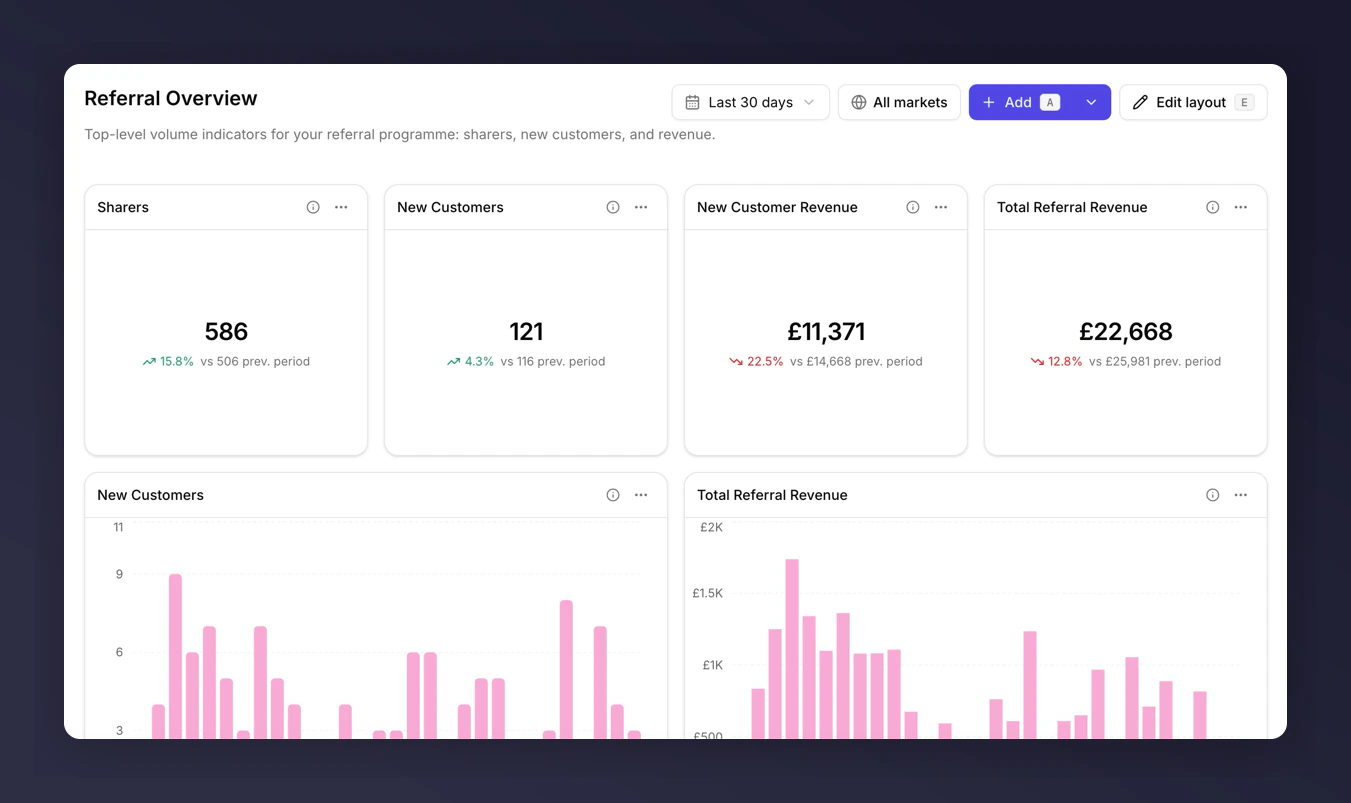
## Referral Overview
**Use when**: you want a one-glance view of programme volume. Good first dashboard for anyone new to Reporting.
**Answers**: "Are the headline numbers moving?"
Six tiles: four metric tiles and two charts showing sharers, new customers, and revenue with compare-to-previous-period.
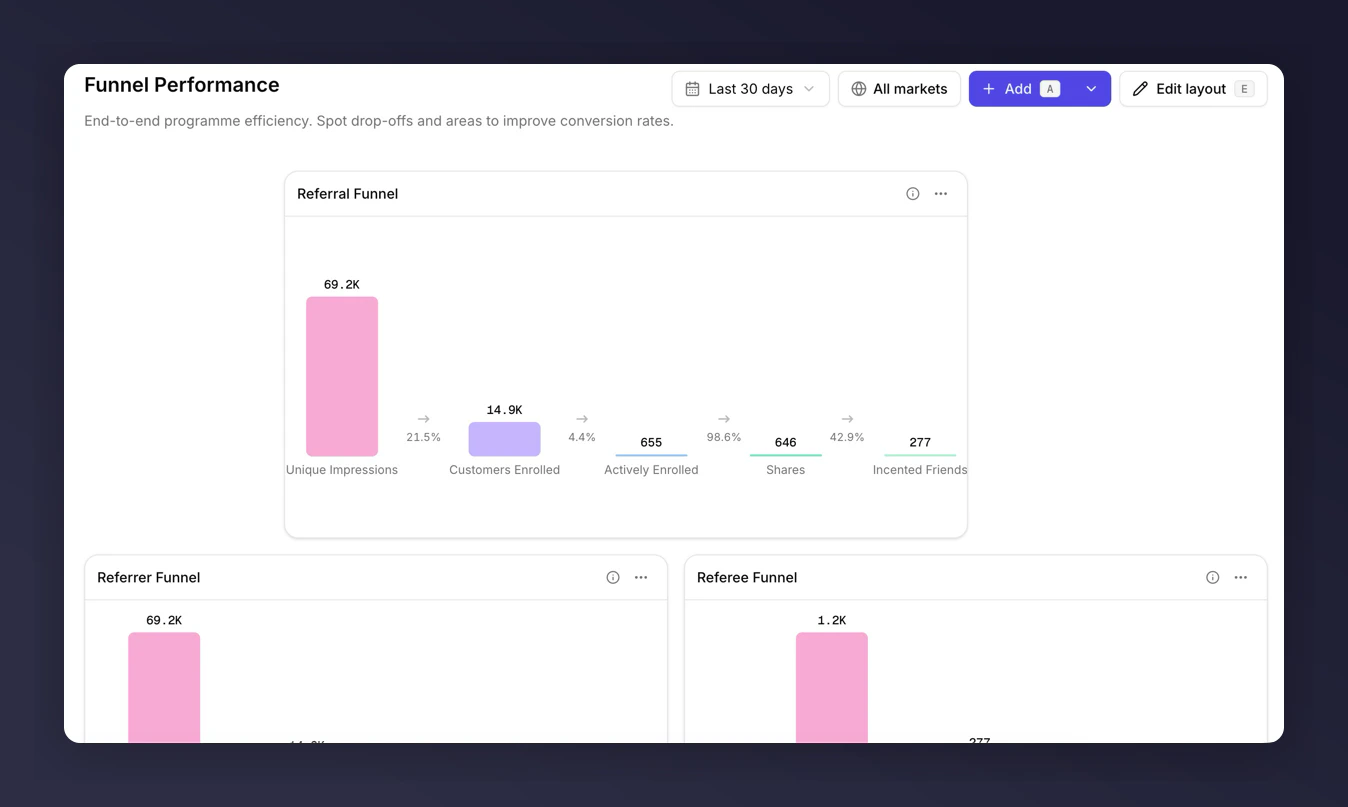
 ## Funnel Performance
**Use when**: you're running the weekly CRM review and need to know which step is leaking.
**Answers**: "Where are we losing people between impression and new customer?"
Thirteen tiles: eight metric tiles covering each funnel stage plus five charts including a funnel chart across the whole flow.
## Funnel Performance
**Use when**: you're running the weekly CRM review and need to know which step is leaking.
**Answers**: "Where are we losing people between impression and new customer?"
Thirteen tiles: eight metric tiles covering each funnel stage plus five charts including a funnel chart across the whole flow.
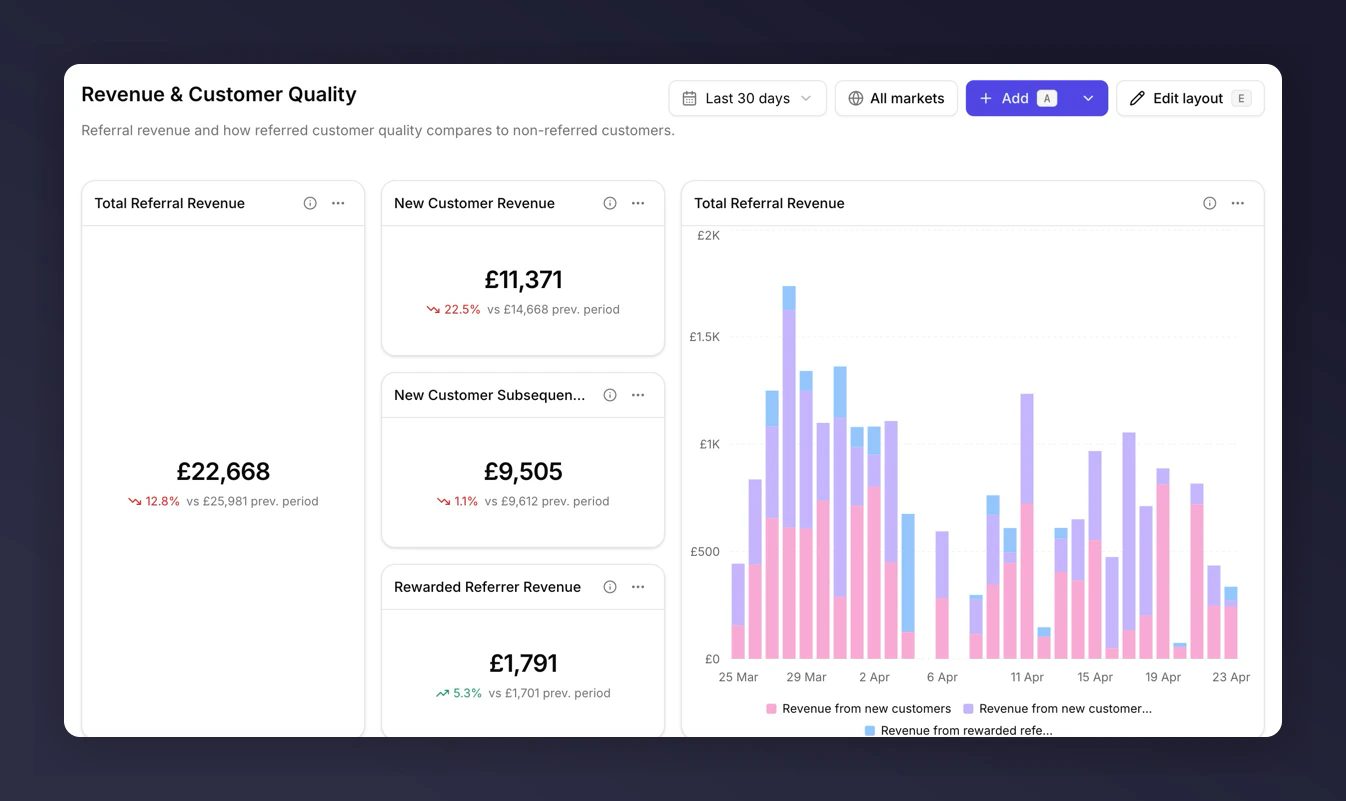
 ## Revenue & Customer Quality
**Use when**: you're walking the exec team through commercial impact, or defending referral budget at a quarterly review.
**Answers**: "Is referral revenue growing, and are referred customers worth more than the average customer?"
Nine tiles: eight metric tiles and one chart covering referral revenue, AOV comparisons, and subsequent-order revenue.
## Revenue & Customer Quality
**Use when**: you're walking the exec team through commercial impact, or defending referral budget at a quarterly review.
**Answers**: "Is referral revenue growing, and are referred customers worth more than the average customer?"
Nine tiles: eight metric tiles and one chart covering referral revenue, AOV comparisons, and subsequent-order revenue.
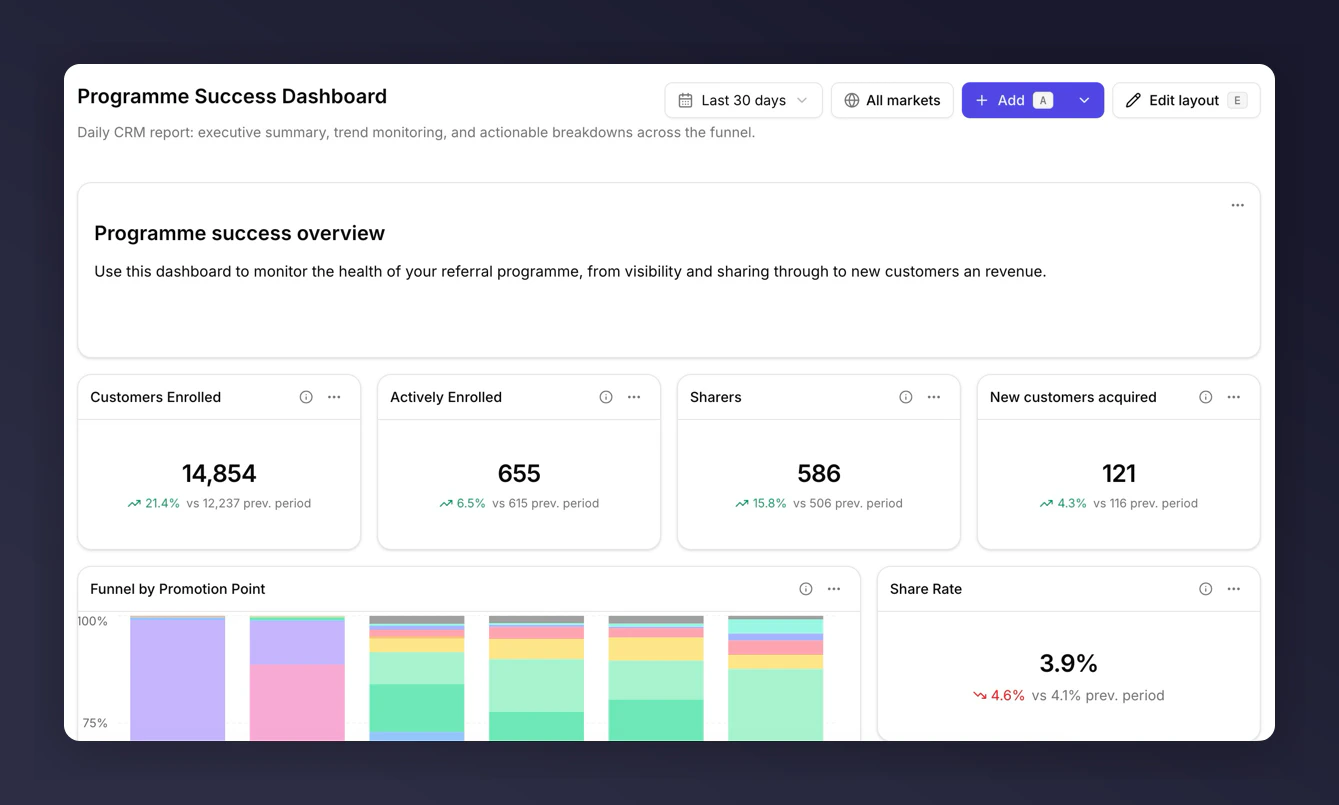
 ## Programme Success Dashboard
**Use when**: you want a daily pulse check across volume, conversion, and campaigns. The most comprehensive template.
**Answers**: "How is the programme doing today, where are the trends going, and which campaigns are driving movement?"
Twenty-three tiles: markdown section headers, executive summary metrics, trend charts across the funnel, and breakdown tables for campaigns. Uses industry benchmark comparisons where eligible.
## Programme Success Dashboard
**Use when**: you want a daily pulse check across volume, conversion, and campaigns. The most comprehensive template.
**Answers**: "How is the programme doing today, where are the trends going, and which campaigns are driving movement?"
Twenty-three tiles: markdown section headers, executive summary metrics, trend charts across the funnel, and breakdown tables for campaigns. Uses industry benchmark comparisons where eligible.
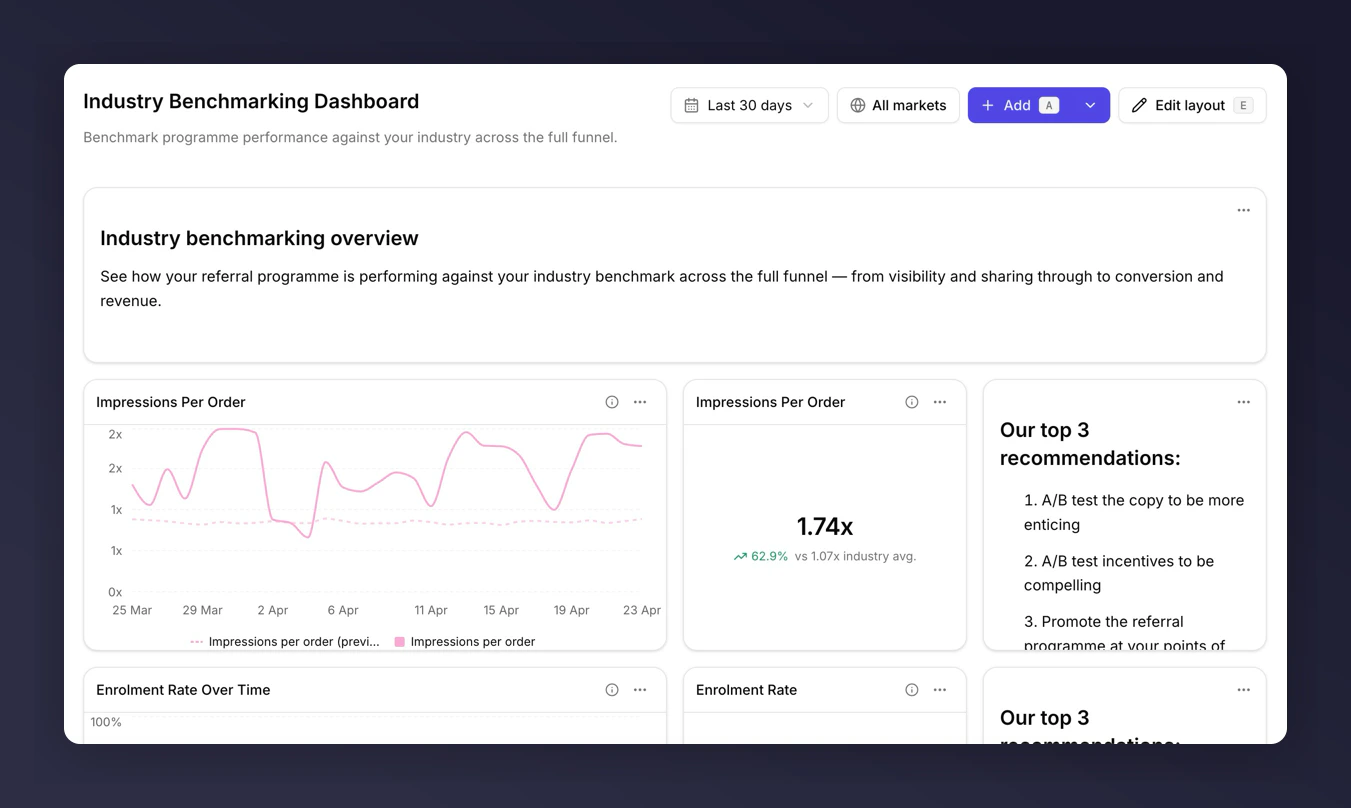
 ## Industry Benchmarking Dashboard
**Use when**: you need to know how the programme compares to peers in your category. Particularly useful before a board update or vendor review.
**Answers**: "Are we above or below industry average at each step?"
Nineteen tiles: seven markdown section headers, six metric tiles, and six charts, all using the Industry benchmark comparison. Only useful if your category has benchmark data available.
## Industry Benchmarking Dashboard
**Use when**: you need to know how the programme compares to peers in your category. Particularly useful before a board update or vendor review.
**Answers**: "Are we above or below industry average at each step?"
Nineteen tiles: seven markdown section headers, six metric tiles, and six charts, all using the Industry benchmark comparison. Only useful if your category has benchmark data available.
 ## What happens after you pick one
Creating a dashboard from a template copies all its tiles, layout, and filter settings into a new dashboard you own. Changes to your dashboard do not affect the template or anyone else's dashboards. Changes to the template (in future updates) do not flow back into dashboards already created from it.
## Which template for which role
* **New to Reporting**. Start with Referral Overview.
* **Weekly CRM review**. Funnel Performance.
* **Exec/stakeholder update**. Revenue & Customer Quality.
* **Daily programme pulse**. Programme Success Dashboard.
* **Peer comparison**. Industry Benchmarking (if eligible).
## What happens after you pick one
Creating a dashboard from a template copies all its tiles, layout, and filter settings into a new dashboard you own. Changes to your dashboard do not affect the template or anyone else's dashboards. Changes to the template (in future updates) do not flow back into dashboards already created from it.
## Which template for which role
* **New to Reporting**. Start with Referral Overview.
* **Weekly CRM review**. Funnel Performance.
* **Exec/stakeholder update**. Revenue & Customer Quality.
* **Daily programme pulse**. Programme Success Dashboard.
* **Peer comparison**. Industry Benchmarking (if eligible).