> ## Documentation Index
> Fetch the complete documentation index at: https://docs.mention-me.com/llms.txt
> Use this file to discover all available pages before exploring further.
# How dashboards work
> The mental model. A dashboard asks a question. Tiles provide the evidence.
A dashboard is one question you want to answer about your referral programme. The tiles on it are the evidence.
Good dashboards are opinionated. "How is revenue tracking this quarter?" is a dashboard. So is "Are we losing people at the share step?" A single "everything I might care about" dashboard usually ends up not used.
## What a dashboard contains
A dashboard holds **tiles** on a **grid**. Tiles are metric numbers, charts, tables, or markdown notes. You arrange them how you like. See [tile types](/knowledge-v2/referral/reporting/building-dashboards/tile-types).
Every dashboard has its own **time period** and **market** filters at the top. Those apply to every tile on the dashboard. See [filters and time periods](/knowledge-v2/referral/reporting/building-dashboards/filters-and-time-periods).
## Scope
Dashboards exist at the **brand level**, not per user. Everyone on your team with Reporting access sees every dashboard that has been created. Dashboards are a shared workspace, not a private notebook.
## Data freshness
Reporting data refreshes **once a day, overnight**. Numbers you see today reflect activity up to the end of yesterday. A dashboard built in the morning will not show today's activity until tomorrow.
## Anatomy
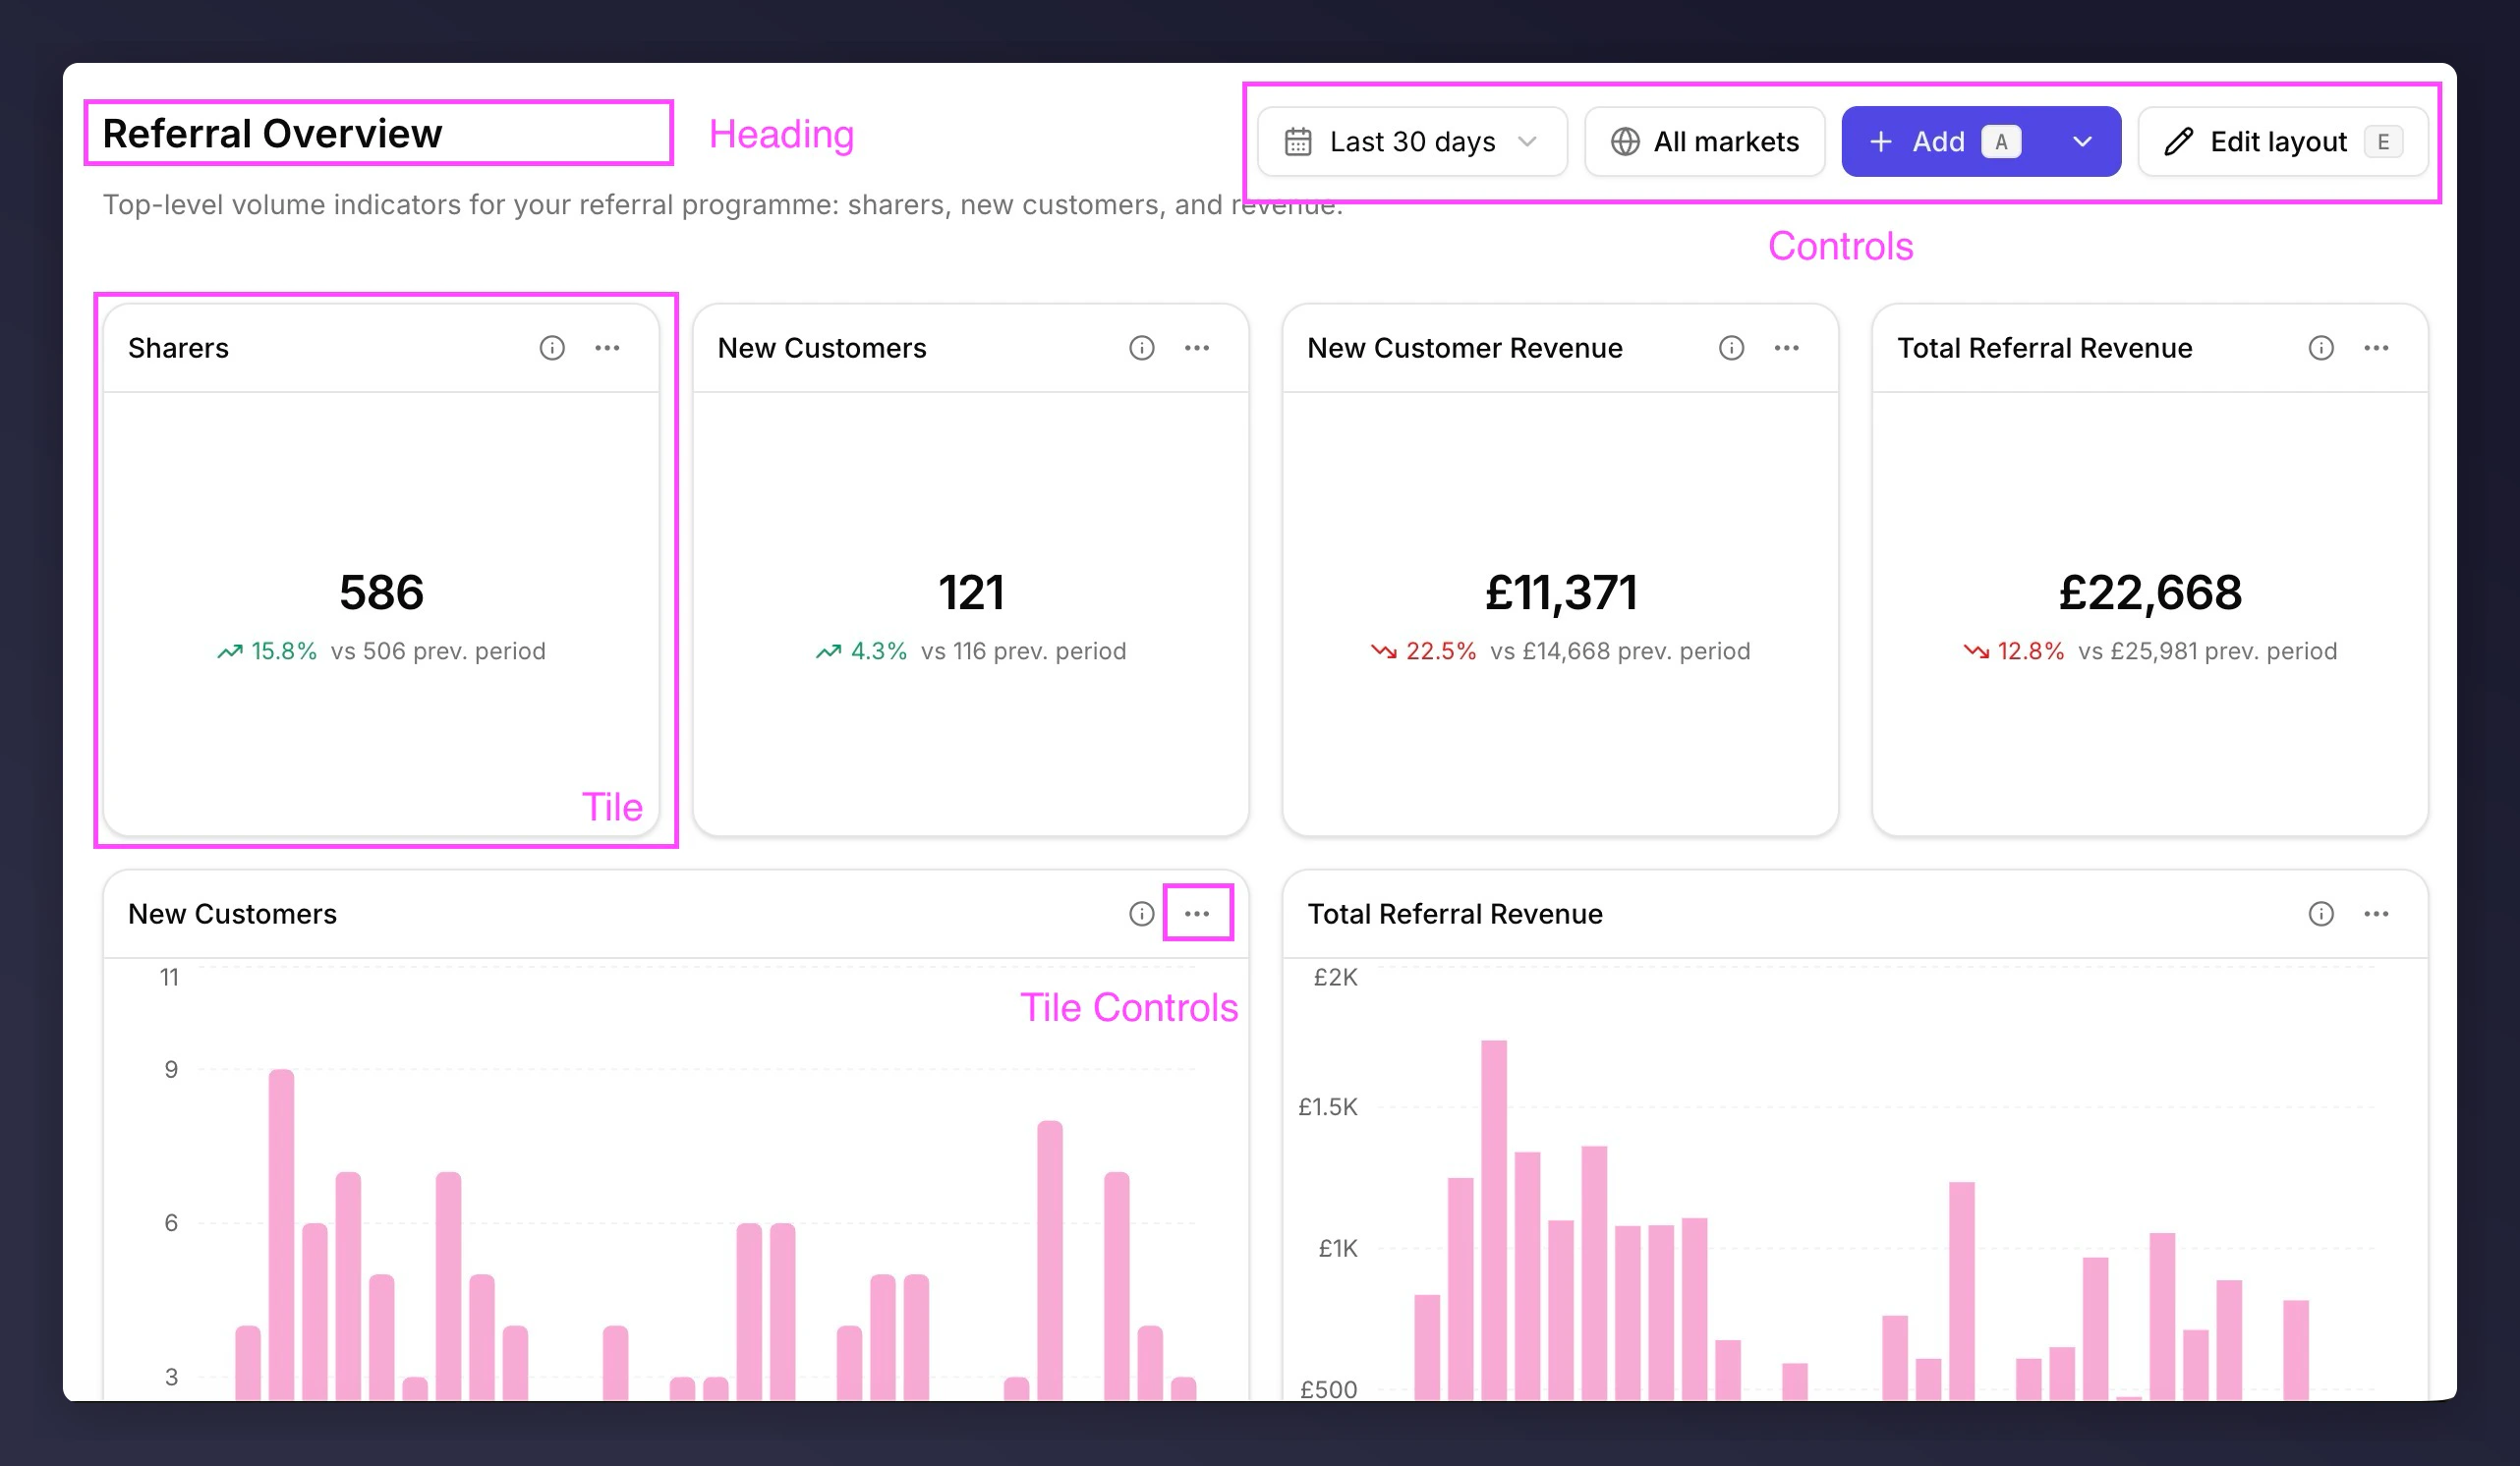 1. **Heading**. Tells anyone landing on the dashboard what question it's answering. Title, description, and breadcrumb back to the dashboards list.
2. **Controls**. Sets the scope. Time period and market filter apply to every tile; `Add` and `Edit layout` change the dashboard itself.
3. **Tile**. The unit of evidence. A metric, chart, table, or markdown note, sitting on a grid of up to 12 columns on desktop, 6 on tablet, and 1 on mobile.
4. **Tile controls**. Per-tile actions. The info icon reveals the metric's technical description; the menu has full screen, edit, rename, duplicate, copy value, export, and remove. Some actions only apply to certain tile types: full screen on charts and tables, copy value on metrics.
## Next
* [What makes a good dashboard](/knowledge-v2/referral/reporting/building-dashboards/what-makes-a-good-dashboard)
* [Tile types](/knowledge-v2/referral/reporting/building-dashboards/tile-types)
* [Your first dashboard](/knowledge-v2/referral/reporting/get-started/your-first-dashboard)
1. **Heading**. Tells anyone landing on the dashboard what question it's answering. Title, description, and breadcrumb back to the dashboards list.
2. **Controls**. Sets the scope. Time period and market filter apply to every tile; `Add` and `Edit layout` change the dashboard itself.
3. **Tile**. The unit of evidence. A metric, chart, table, or markdown note, sitting on a grid of up to 12 columns on desktop, 6 on tablet, and 1 on mobile.
4. **Tile controls**. Per-tile actions. The info icon reveals the metric's technical description; the menu has full screen, edit, rename, duplicate, copy value, export, and remove. Some actions only apply to certain tile types: full screen on charts and tables, copy value on metrics.
## Next
* [What makes a good dashboard](/knowledge-v2/referral/reporting/building-dashboards/what-makes-a-good-dashboard)
* [Tile types](/knowledge-v2/referral/reporting/building-dashboards/tile-types)
* [Your first dashboard](/knowledge-v2/referral/reporting/get-started/your-first-dashboard)