> ## Documentation Index
> Fetch the complete documentation index at: https://docs.mention-me.com/llms.txt
> Use this file to discover all available pages before exploring further.
# Breakdowns
> Split a metric by campaign, market, or any other dimension.
Breakdowns turn "200 new customers" into "Campaign A drove 70% of our new customers". The second is what stakeholders actually want.
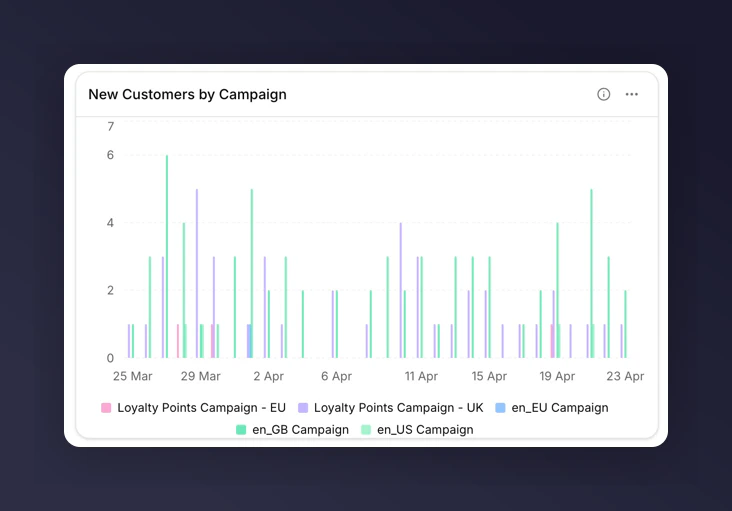
A breakdown splits a metric so you can see the parts, not just the total. "New Customers by Campaign" gives one segment per campaign instead of one lump sum.
For the full list of available breakdowns and what each one means, see the [breakdowns glossary](/knowledge-v2/referral/reporting/reference/dimensions-glossary).
## Where breakdowns apply
Breakdowns work on **chart** and **table** tiles.
* **Metric tiles**. Do not support breakdowns. Use a chart or table instead.
* **Line and bar charts**. Breakdown is optional. Adding one renders multiple series (one per value).
* **Stacked bar**. Breakdown is optional. Pair with a breakdown to stack its values; without one, multiple metrics stack instead.
* **Share**. Breakdown is optional. Segments come from breakdown values, or from multiple metrics if no breakdown is set.
* **Funnel**. Breakdown is not supported.
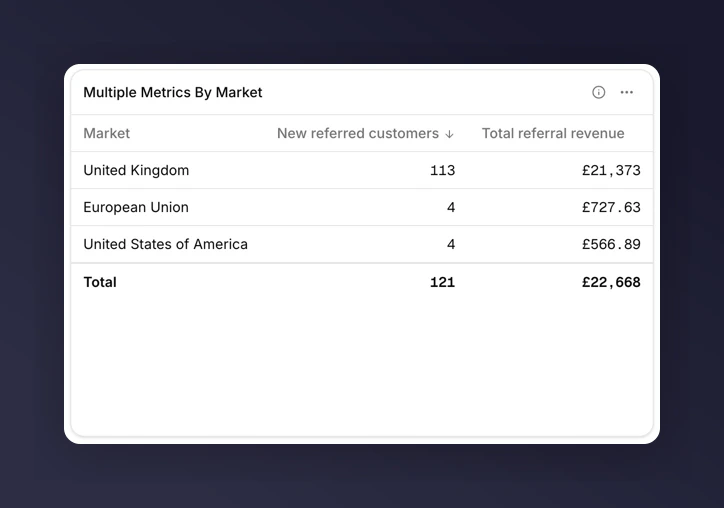
* **Table**. Breakdown is optional. Each row of the table becomes a value of the breakdown.
## Add a breakdown
1. Edit the chart or table tile.
2. In the tile editor, find the **Breakdown** field.
3. Pick a breakdown from the list.
4. Save.
 ## Top-N and "Other"
Charts and tables show the top values by volume. Everything else collapses into an "Other" segment so the tile stays readable when a breakdown has many values (e.g. many campaigns or markets).
To inspect the long tail, export the tile to CSV and look at the raw rows there.
## The mutual-exclusion rule
You can have a breakdown **or** a comparison on a tile, but not both.
* Add a breakdown to a tile that already has "Compare to last year" set, and the comparison clears.
* Add a comparison to a tile that already has a breakdown, and the breakdown clears.
If you need to see a metric broken down by campaign **and** compared to last year, use two tiles: one with the breakdown, one with the comparison.
## Next
* [Breakdowns glossary](/knowledge-v2/referral/reporting/reference/dimensions-glossary) for all nine dimensions.
* [Chart types](/knowledge-v2/referral/reporting/reference/chart-types) for which charts require or forbid a breakdown.
* [Track campaign performance](/knowledge-v2/referral/reporting/common-tasks/track-campaign-performance) for a worked example.
## Top-N and "Other"
Charts and tables show the top values by volume. Everything else collapses into an "Other" segment so the tile stays readable when a breakdown has many values (e.g. many campaigns or markets).
To inspect the long tail, export the tile to CSV and look at the raw rows there.
## The mutual-exclusion rule
You can have a breakdown **or** a comparison on a tile, but not both.
* Add a breakdown to a tile that already has "Compare to last year" set, and the comparison clears.
* Add a comparison to a tile that already has a breakdown, and the breakdown clears.
If you need to see a metric broken down by campaign **and** compared to last year, use two tiles: one with the breakdown, one with the comparison.
## Next
* [Breakdowns glossary](/knowledge-v2/referral/reporting/reference/dimensions-glossary) for all nine dimensions.
* [Chart types](/knowledge-v2/referral/reporting/reference/chart-types) for which charts require or forbid a breakdown.
* [Track campaign performance](/knowledge-v2/referral/reporting/common-tasks/track-campaign-performance) for a worked example.