> ## Documentation Index
> Fetch the complete documentation index at: https://docs.mention-me.com/llms.txt
> Use this file to discover all available pages before exploring further.
# How to Use the Integration Logs
> Inspect tag fires, orders, and anything that Needs attention on the Logs page.
Open **Settings > Logs** to inspect integration signals: tag fires, orders, and validation issues.
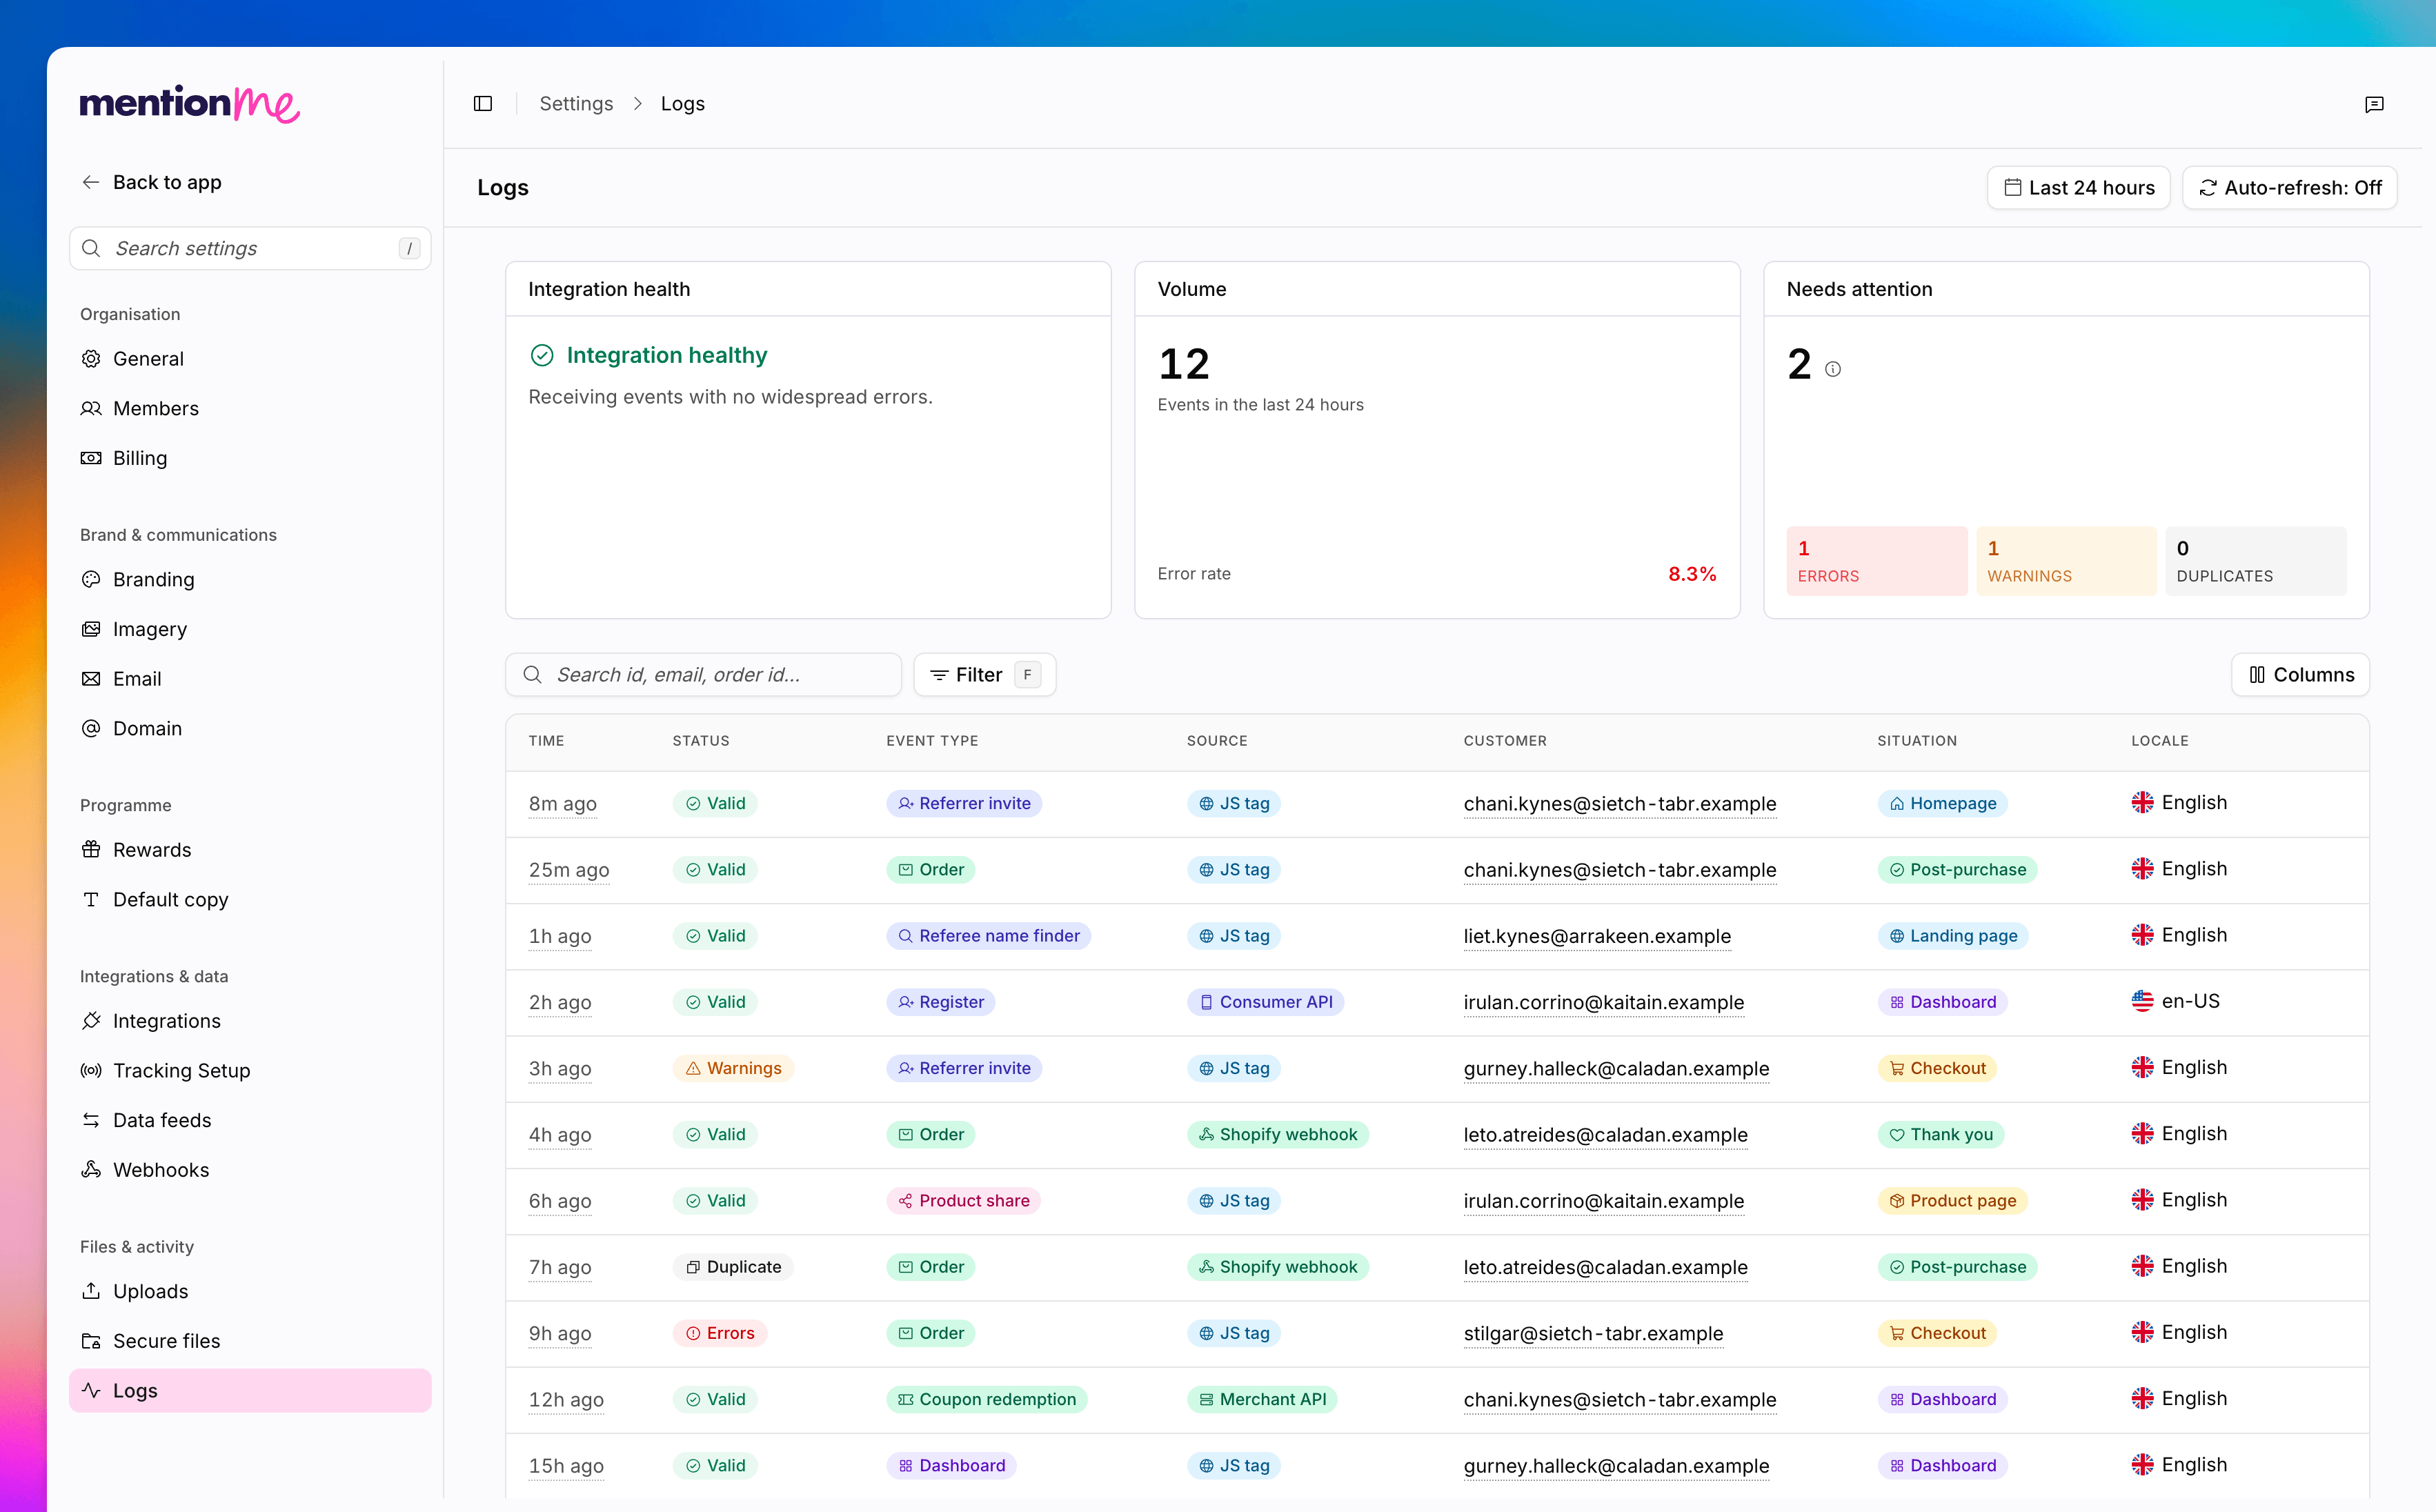 This is the app.mention-me.com home for what Classic calls the debug dashboard. See [Understanding the Debug Dashboard](/knowledge/tags/debug-dashboard) for the Classic screen.
Everyone in the organisation can open Logs. Use it after [tracking setup](/knowledge-app/settings/integrations/tracking-setup) to confirm tags are firing.
## Read the Summary Cards
| Card | What it shows |
| ---------------------- | ---------------------------------------------------------------------------------------------------------------------------------------------------------------- |
| **Integration health** | Healthy, no recent events, or an error rate. Shortcuts include a 30-day window and **Show errors only**. |
| **Volume** | How many events landed in the selected window, plus the error rate. Clicking the error rate filters the table to errors. |
| **Needs attention** | Counts for **errors**, **warnings**, and **duplicates**. Click a pill to filter. Expected Shopify webhook duplicates are excluded; an info tip explains the gap. |
## Filter and Search
The header has a time range (**Last hour**, **Last 24 hours**, **Last 7 days**, **Last 30 days**) and an auto-refresh toggle. The default window is the last 24 hours.
Filters include status, event type, source, situation, locale, currency, and app / version. Status values are **Valid**, **Errors**, **Warnings**, and **Duplicates**.
Search accepts an id, email, or order id. The placeholder is **Search id, email, order id...**
Click a row to open the event detail, including the payload and validation messages.
## See Also
Choose an install method and find tag snippets.
Classic documentation for the same kind of signal log.
This is the app.mention-me.com home for what Classic calls the debug dashboard. See [Understanding the Debug Dashboard](/knowledge/tags/debug-dashboard) for the Classic screen.
Everyone in the organisation can open Logs. Use it after [tracking setup](/knowledge-app/settings/integrations/tracking-setup) to confirm tags are firing.
## Read the Summary Cards
| Card | What it shows |
| ---------------------- | ---------------------------------------------------------------------------------------------------------------------------------------------------------------- |
| **Integration health** | Healthy, no recent events, or an error rate. Shortcuts include a 30-day window and **Show errors only**. |
| **Volume** | How many events landed in the selected window, plus the error rate. Clicking the error rate filters the table to errors. |
| **Needs attention** | Counts for **errors**, **warnings**, and **duplicates**. Click a pill to filter. Expected Shopify webhook duplicates are excluded; an info tip explains the gap. |
## Filter and Search
The header has a time range (**Last hour**, **Last 24 hours**, **Last 7 days**, **Last 30 days**) and an auto-refresh toggle. The default window is the last 24 hours.
Filters include status, event type, source, situation, locale, currency, and app / version. Status values are **Valid**, **Errors**, **Warnings**, and **Duplicates**.
Search accepts an id, email, or order id. The placeholder is **Search id, email, order id...**
Click a row to open the event detail, including the payload and validation messages.
## See Also
Choose an install method and find tag snippets.
Classic documentation for the same kind of signal log.