> ## Documentation Index
> Fetch the complete documentation index at: https://docs.mention-me.com/llms.txt
> Use this file to discover all available pages before exploring further.
# How to Build a Dashboard with AI
> Describe what you want. AI builds the dashboard.
Describe what you want to track. The AI builds the dashboard.
The AI Dashboard Builder takes a plain-English description and assembles a dashboard with the right tiles, metrics, and breakdowns. You can tweak anything afterwards.
 ## When to Use It
AI works best for big-picture asks and exploratory questions:
* "Show me how the programme is doing overall vs last month."
* "Where am I losing customers in the funnel?"
* "Which markets are growing fastest?"
It is less good when you already know the exact tiles you want. For that, [build from scratch](/knowledge-app/referral/reporting/get-started/your-first-dashboard) is quicker.
## How to Start
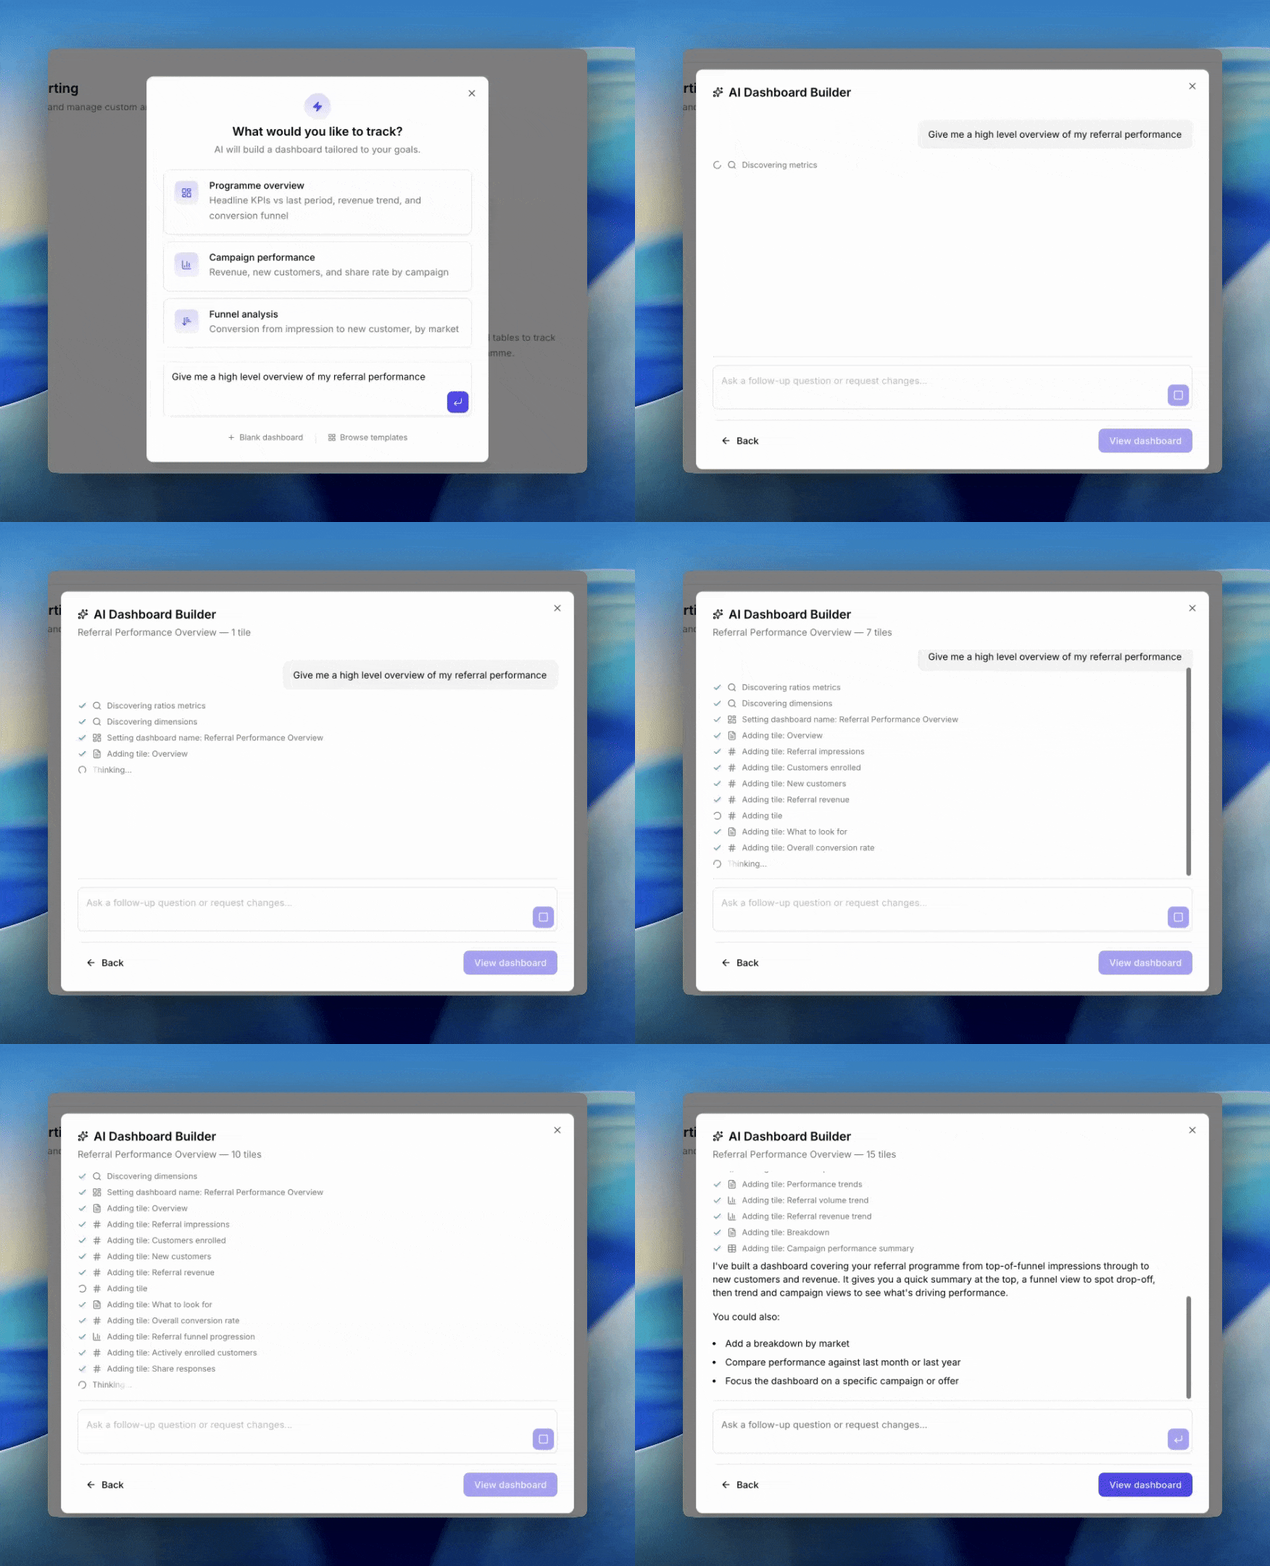
Go to **Referral > Reporting** and click **New dashboard**. The dialog opens with three paths: a prompt textarea, three suggestions, and links to Blank or Browse templates underneath.
You have two ways to kick off AI:
1. **Click a suggestion.** Three starters are ready to go.
2. **Type your own prompt** in the textarea.
### The Three Suggestion Starters
* **Programme overview**. Headline KPIs vs last period, revenue trend, and conversion funnel.
* **Campaign performance**. Revenue, new customers, and share rate by campaign.
* **Funnel analysis**. Conversion from impression to new customer, by market.
## Writing a Good Prompt
The AI gets better results with a little specificity. Include:
* **Time period**. "For the last 30 days", "year to date", "this quarter vs last quarter".
* **The decision you are making**. "I want to know whether campaign X is outperforming campaign Y."
* **Breakdowns of interest**. "Split by market", "by share type", "per campaign".
A vague prompt ("how are we doing") still works but will give you something generic.
## During the Conversation
Once you submit, the dialog switches to chat mode. You'll see the AI stream its reasoning and tile-building steps. The header shows a running count of tiles in the draft.
You can keep chatting to refine:
* "Add a market breakdown to the revenue chart."
* "Swap the time period to year to date."
* "Remove the markdown intro tile."
When you're happy, click **View dashboard**. The dashboard is saved and opens.
## Limitations
* Review the result before saving. The AI sometimes picks the wrong metric or the wrong chart type. Use [choosing a chart](/knowledge-app/referral/reporting/building-dashboards/choosing-a-chart) as a sanity check.
* Anything you can do by hand, you can still do afterwards. AI is a starting point, not a sealed result.
* The AI can only use metrics and breakdowns that exist in Reporting. If you ask for something we do not measure, it will substitute the closest available.
## Next
Which of the five chart types fits the question you're asking.
Drag, resize, and arrange tiles on the dashboard grid.
## When to Use It
AI works best for big-picture asks and exploratory questions:
* "Show me how the programme is doing overall vs last month."
* "Where am I losing customers in the funnel?"
* "Which markets are growing fastest?"
It is less good when you already know the exact tiles you want. For that, [build from scratch](/knowledge-app/referral/reporting/get-started/your-first-dashboard) is quicker.
## How to Start
Go to **Referral > Reporting** and click **New dashboard**. The dialog opens with three paths: a prompt textarea, three suggestions, and links to Blank or Browse templates underneath.
You have two ways to kick off AI:
1. **Click a suggestion.** Three starters are ready to go.
2. **Type your own prompt** in the textarea.
### The Three Suggestion Starters
* **Programme overview**. Headline KPIs vs last period, revenue trend, and conversion funnel.
* **Campaign performance**. Revenue, new customers, and share rate by campaign.
* **Funnel analysis**. Conversion from impression to new customer, by market.
## Writing a Good Prompt
The AI gets better results with a little specificity. Include:
* **Time period**. "For the last 30 days", "year to date", "this quarter vs last quarter".
* **The decision you are making**. "I want to know whether campaign X is outperforming campaign Y."
* **Breakdowns of interest**. "Split by market", "by share type", "per campaign".
A vague prompt ("how are we doing") still works but will give you something generic.
## During the Conversation
Once you submit, the dialog switches to chat mode. You'll see the AI stream its reasoning and tile-building steps. The header shows a running count of tiles in the draft.
You can keep chatting to refine:
* "Add a market breakdown to the revenue chart."
* "Swap the time period to year to date."
* "Remove the markdown intro tile."
When you're happy, click **View dashboard**. The dashboard is saved and opens.
## Limitations
* Review the result before saving. The AI sometimes picks the wrong metric or the wrong chart type. Use [choosing a chart](/knowledge-app/referral/reporting/building-dashboards/choosing-a-chart) as a sanity check.
* Anything you can do by hand, you can still do afterwards. AI is a starting point, not a sealed result.
* The AI can only use metrics and breakdowns that exist in Reporting. If you ask for something we do not measure, it will substitute the closest available.
## Next
Which of the five chart types fits the question you're asking.
Drag, resize, and arrange tiles on the dashboard grid.