> ## Documentation Index
> Fetch the complete documentation index at: https://docs.mention-me.com/llms.txt
> Use this file to discover all available pages before exploring further.
# How to Monitor Revenue Quality
> Track whether referred customers are good customers.
**Question**: "Are referred customers worth more than the average customer?"
Referral's commercial case usually hinges on two things: higher average order value and better repeat-purchase behaviour. Two metric pairs tell that story.
## Fastest Path: Revenue & Customer Quality Template
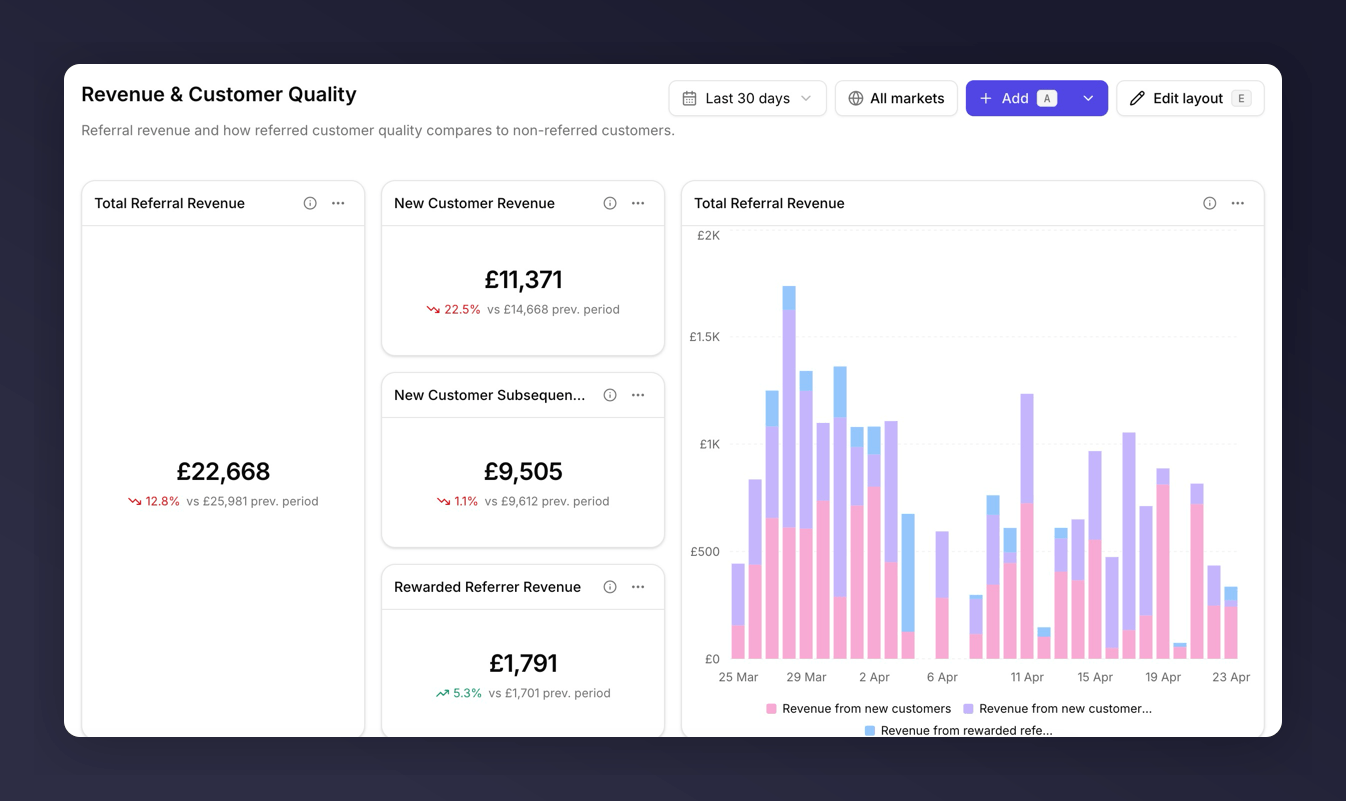
The [Revenue & Customer Quality template](/knowledge-app/referral/reporting/reference/templates-catalogue) assembles this view. Nine tiles, mostly metric cards.
**New dashboard > Browse templates > Revenue & Customer Quality**.
 ## Build It Yourself
### 1. First-Order Value: Referred vs Non-Referred
Two metric tiles side by side:
* **New Customer AOV**
* **Non-Referred Customer AOV**
Set both to compare against **Last year** or **Previous period**, whichever is most relevant.
If New Customer AOV is consistently higher, referred customers are spending more on their first orders. A typical pattern: New Customer AOV £85 vs Non-Referred £62. That's a 37% premium worth showing in any commercial review.
### 2. Repeat-Purchase Value
One line chart:
* **New Customer Subsequent Revenue** over time (last 12 months).
This is spend from referred customers beyond their first order. A rising line means referred customers are coming back, which is where the long-term commercial case lives.
### 3. Headline Revenue
One metric tile:
* **Total Referral Revenue** with **Compare to previous period**.
## The Usual Story
Across most referral programmes, referred customers:
* Have a higher AOV on first orders than non-referred customers.
* Repeat purchase at a higher rate.
* Therefore contribute more subsequent revenue per head over time.
Your dashboard is either confirming this pattern for your programme or highlighting where it's not holding, which is itself useful.
## Next
See what each revenue metric covers.
Turn this dashboard into a deck or email.
## Build It Yourself
### 1. First-Order Value: Referred vs Non-Referred
Two metric tiles side by side:
* **New Customer AOV**
* **Non-Referred Customer AOV**
Set both to compare against **Last year** or **Previous period**, whichever is most relevant.
If New Customer AOV is consistently higher, referred customers are spending more on their first orders. A typical pattern: New Customer AOV £85 vs Non-Referred £62. That's a 37% premium worth showing in any commercial review.
### 2. Repeat-Purchase Value
One line chart:
* **New Customer Subsequent Revenue** over time (last 12 months).
This is spend from referred customers beyond their first order. A rising line means referred customers are coming back, which is where the long-term commercial case lives.
### 3. Headline Revenue
One metric tile:
* **Total Referral Revenue** with **Compare to previous period**.
## The Usual Story
Across most referral programmes, referred customers:
* Have a higher AOV on first orders than non-referred customers.
* Repeat purchase at a higher rate.
* Therefore contribute more subsequent revenue per head over time.
Your dashboard is either confirming this pattern for your programme or highlighting where it's not holding, which is itself useful.
## Next
See what each revenue metric covers.
Turn this dashboard into a deck or email.