> ## Documentation Index
> Fetch the complete documentation index at: https://docs.mention-me.com/llms.txt
> Use this file to discover all available pages before exploring further.
# How to Export Data
> Get the numbers out into a spreadsheet.
**Question**: "How do I get this into a spreadsheet?"
Every data-bearing tile can export to CSV. A metric tile can also copy its value to your clipboard for a single number.
## Export a Tile to CSV
1. Click the three-dot menu in the top corner of the tile.
2. Click **Export CSV**.
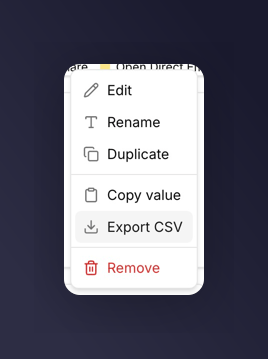 A CSV downloads with the data behind the tile.
## What's in the CSV
Depends on the tile type.
### Metric Tile
A single row with the metric name, value, and the comparison value if one is set.
### Chart Tile
One row per data point. Columns cover each metric plotted. If the chart has a breakdown, one row per combination of time bucket and breakdown value.
### Table Tile
Exactly what you see on screen. One row per table row, one column per metric. If the table has a breakdown, the breakdown value is the first column.
### Markdown Tile
Markdown tiles cannot be exported. There's no data behind them, so the menu hides the Export CSV option.
## Copy a Single Value
For metric tiles specifically, there's a shortcut that skips the CSV step:
1. Open the tile menu.
2. Click **Copy value**.
The number goes to your clipboard in a format that pastes cleanly into text, email, or a spreadsheet cell.
## Filters and Comparisons Carry Over
The CSV reflects the tile as you see it:
* The dashboard's time period and market filter are applied.
* If the tile has a comparison, the comparison values are included as extra columns.
* If the tile has a breakdown, each breakdown value appears as its own row or group of rows.
## What You Cannot Export
There is no "export the whole dashboard" action. Export each tile separately.
## Next
See patterns around packaging these exports.
Shape what ends up in the CSV before you export.
A CSV downloads with the data behind the tile.
## What's in the CSV
Depends on the tile type.
### Metric Tile
A single row with the metric name, value, and the comparison value if one is set.
### Chart Tile
One row per data point. Columns cover each metric plotted. If the chart has a breakdown, one row per combination of time bucket and breakdown value.
### Table Tile
Exactly what you see on screen. One row per table row, one column per metric. If the table has a breakdown, the breakdown value is the first column.
### Markdown Tile
Markdown tiles cannot be exported. There's no data behind them, so the menu hides the Export CSV option.
## Copy a Single Value
For metric tiles specifically, there's a shortcut that skips the CSV step:
1. Open the tile menu.
2. Click **Copy value**.
The number goes to your clipboard in a format that pastes cleanly into text, email, or a spreadsheet cell.
## Filters and Comparisons Carry Over
The CSV reflects the tile as you see it:
* The dashboard's time period and market filter are applied.
* If the tile has a comparison, the comparison values are included as extra columns.
* If the tile has a breakdown, each breakdown value appears as its own row or group of rows.
## What You Cannot Export
There is no "export the whole dashboard" action. Export each tile separately.
## Next
See patterns around packaging these exports.
Shape what ends up in the CSV before you export.