> ## Documentation Index
> Fetch the complete documentation index at: https://docs.mention-me.com/llms.txt
> Use this file to discover all available pages before exploring further.
# Understanding Filters and Time Periods
> Focus the whole dashboard on what you care about.
Every dashboard has a filter bar at the top. It applies to every tile on the grid. Change any filter and the whole dashboard updates in place.
## Dashboard Filter Bar
Two filters live at the top of every dashboard:
* **Time period**. The date range for every tile.
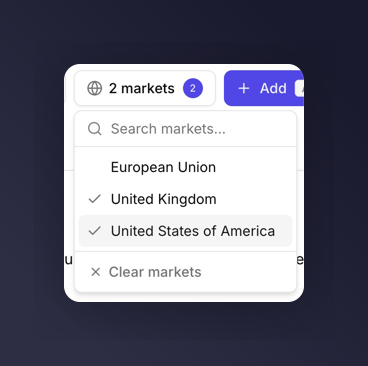
* **Market**. Multi-select. Leave empty to include all markets.
The filter bar also holds the `Add` tile and `Edit layout` buttons.
## Time Periods
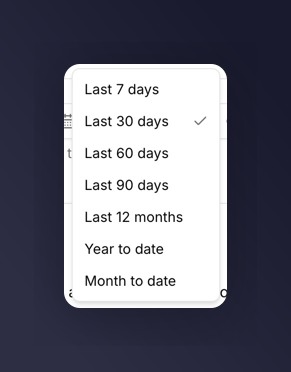
Seven preset time periods plus a custom date range:
* Last 7 days
* Last 30 days (default)
* Last 60 days
* Last 90 days
* Last 12 months
* Year to date
* Month to date
* Custom date range
 Picking **Custom date range** reveals start and end date inputs.
For a daily check-in, leave the time period on Last 30 days. For a quarterly review, switch to Last 90 days or Year to date. For a year-on-year story, use Last 12 months with `Compare to last year` on individual tiles.
## Market Filter
The Market filter is multi-select. Pick one or more markets to scope the whole dashboard, or leave it empty to include everything.
Picking **Custom date range** reveals start and end date inputs.
For a daily check-in, leave the time period on Last 30 days. For a quarterly review, switch to Last 90 days or Year to date. For a year-on-year story, use Last 12 months with `Compare to last year` on individual tiles.
## Market Filter
The Market filter is multi-select. Pick one or more markets to scope the whole dashboard, or leave it empty to include everything.
 ### Metrics That Ignore the Market Filter
A handful of metrics are business-wide and do not scope to a market. When they appear on a dashboard with a market filter active, they render the business-wide number regardless of what's selected.
* Total Orders
* Product Referral metrics (when they appear)
For the full list of which metrics support market filtering, see the [metrics glossary](/knowledge-app/referral/reporting/reference/metrics-glossary).
## Next
Compare a tile to a previous period or the industry benchmark.
Split a metric by campaign, market, or any other dimension.
### Metrics That Ignore the Market Filter
A handful of metrics are business-wide and do not scope to a market. When they appear on a dashboard with a market filter active, they render the business-wide number regardless of what's selected.
* Total Orders
* Product Referral metrics (when they appear)
For the full list of which metrics support market filtering, see the [metrics glossary](/knowledge-app/referral/reporting/reference/metrics-glossary).
## Next
Compare a tile to a previous period or the industry benchmark.
Split a metric by campaign, market, or any other dimension.