> ## Documentation Index
> Fetch the complete documentation index at: https://docs.mention-me.com/llms.txt
> Use this file to discover all available pages before exploring further.
# Understanding Comparisons
> Tell whether a number is good by comparing it to something.
A number on its own doesn't tell you much. Revenue of £120,000 is good or bad depending on whether last quarter was £90,000 or £200,000. A 4.2% Share Rate is impressive against an industry average of 2.8%, and underwhelming against 6.5%. Comparisons give the context.
Pair every number with a comparison before showing it outside the team. Without context, the first question is always "is that good?".
## Five Compare Modes
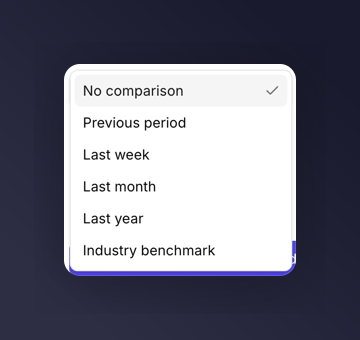
Metric, chart (line or bar), and table tiles all support a **Compare to** setting:
* **Previous period**. Compare against the same length of time immediately before the current one.
* **Last week**. Compare against the equivalent 7-day block a week ago.
* **Last month**. Compare against the equivalent month-long block a month ago.
* **Last year**. Compare against the same period a year earlier.
* **Industry benchmark**. Compare against the industry average for your category. Only shown when eligible (see below).
## How Comparison Renders
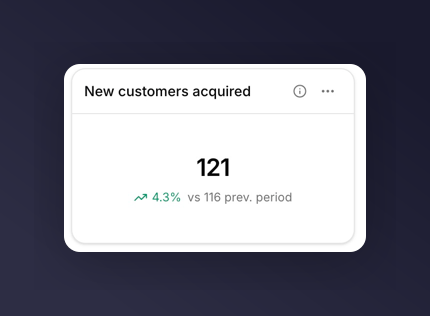
On a **metric** tile, a small delta badge appears next to the value: `+12.3%` in green if the metric is up, `-4.1%` in red if it's down. The comparison value sits beneath the main number.
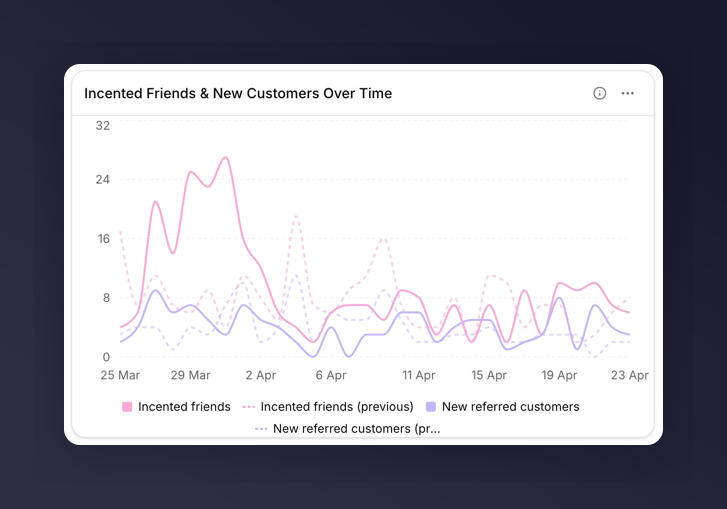
 On a **line or bar chart** tile, comparison renders as a dashed line or set of faded bars alongside the main series.
 On a **table** tile, comparison adds a delta column per metric.
## Constraints
* **Share, funnel, and stacked bar charts don't support comparison.** Switch the chart type to line or bar if you need it.
* **Comparison and breakdown are mutually exclusive.** Clear the breakdown to turn comparison on, or vice versa.
* On tables, setting a breakdown disables the compare column automatically.
## Industry Benchmark
The **Industry benchmark** compare mode shows your tile's metric alongside the industry benchmark for your category. When you hover a comparison point on a chart the tooltip reads "industry avg." for that value.
On a **table** tile, comparison adds a delta column per metric.
## Constraints
* **Share, funnel, and stacked bar charts don't support comparison.** Switch the chart type to line or bar if you need it.
* **Comparison and breakdown are mutually exclusive.** Clear the breakdown to turn comparison on, or vice versa.
* On tables, setting a breakdown disables the compare column automatically.
## Industry Benchmark
The **Industry benchmark** compare mode shows your tile's metric alongside the industry benchmark for your category. When you hover a comparison point on a chart the tooltip reads "industry avg." for that value.
 ### Eligibility
Industry benchmark is available only when:
1. Your brand is in a category that has benchmark data available.
2. The metric supports benchmark comparison.
Eight metrics are benchmark-eligible:
* Enrolment Rate
* Share Rate
* Purchase Rate
* Impressions per Order
* Shares per Sharer
* Responses per Share
* Incented Friends per Share Response
* Purchases per Incented Friend
If your category has no benchmark data, the Industry benchmark option does not appear in the compare picker, even for eligible metrics.
For a ready-made view that uses benchmark comparison, pick the [Industry Benchmarking template](/knowledge-app/referral/reporting/reference/templates-catalogue).
## Next
See which chart types accept comparisons.
See which metrics are benchmark-eligible.
### Eligibility
Industry benchmark is available only when:
1. Your brand is in a category that has benchmark data available.
2. The metric supports benchmark comparison.
Eight metrics are benchmark-eligible:
* Enrolment Rate
* Share Rate
* Purchase Rate
* Impressions per Order
* Shares per Sharer
* Responses per Share
* Incented Friends per Share Response
* Purchases per Incented Friend
If your category has no benchmark data, the Industry benchmark option does not appear in the compare picker, even for eligible metrics.
For a ready-made view that uses benchmark comparison, pick the [Industry Benchmarking template](/knowledge-app/referral/reporting/reference/templates-catalogue).
## Next
See which chart types accept comparisons.
See which metrics are benchmark-eligible.